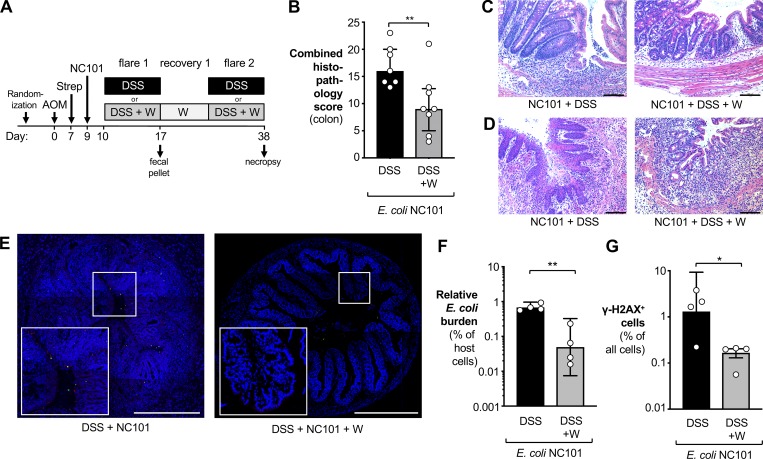
Figure 5.
Analysis of DNA damage and intestinal inflammation. (A) Groups of C57BL/6 mice were treated i.p. with 20 mg/kg AOM. After 7 d, animals received streptomycin (2 mg/ml in the drinking water) and were intragastrically inoculated with the colibactin-producing E. coli NC101 2 d later. Mice were treated for 1 wk with either 2% DSS (black bars) or 2% DSS supplemented with 0.2% sodium tungstate (W; gray bars). Animals were allowed to recover for 2 wk, with the tungsten-treated group receiving 0.2% sodium tungstate throughout the experiment. After 38 d, samples of the colon were obtained. Data from two independent experiments are shown. (B–D) H&E-stained sections were scored by a veterinary pathologist for epithelial damage, polymorphonuclear neutrophil infiltration, submucosal edema, and exudate in the lumen. DSS group: n = 7; DSS+W group: n = 8. (B) Combined histopathology score. Bars indicate the median and the interquartile range. P values were calculated by two-tailed Mann–Whitney U test. (C and D) Representative images of H&E-stained sections of the proximal (C) and distal (D) colon. Scale bars represent 100 µm. (E–G) Transverse sections of colonic tissues were stained for E. coli (red), DNA damage using γ-H2AX foci as marker (green), and cell nuclei (blue). Individual image tiles were assembled to quantify E. coli burden and number of γ-H2AX–positive cells and total mammalian cells. Both groups: n = 4. (E) Representative images. Scale bars represent 500 µm. (F) Burden of E. coli normalized to the number of mammalian cells. (G) Abundance of γ-H2AX–positive cells normalized to the number of all mammalian cells. For F and G, P values were calculated by unpaired, two-tailed Student’s t test on log-transformed data. Bars represent the geometric mean ± 95% confidence interval. *, P < 0.05; **, P < 0.01.

