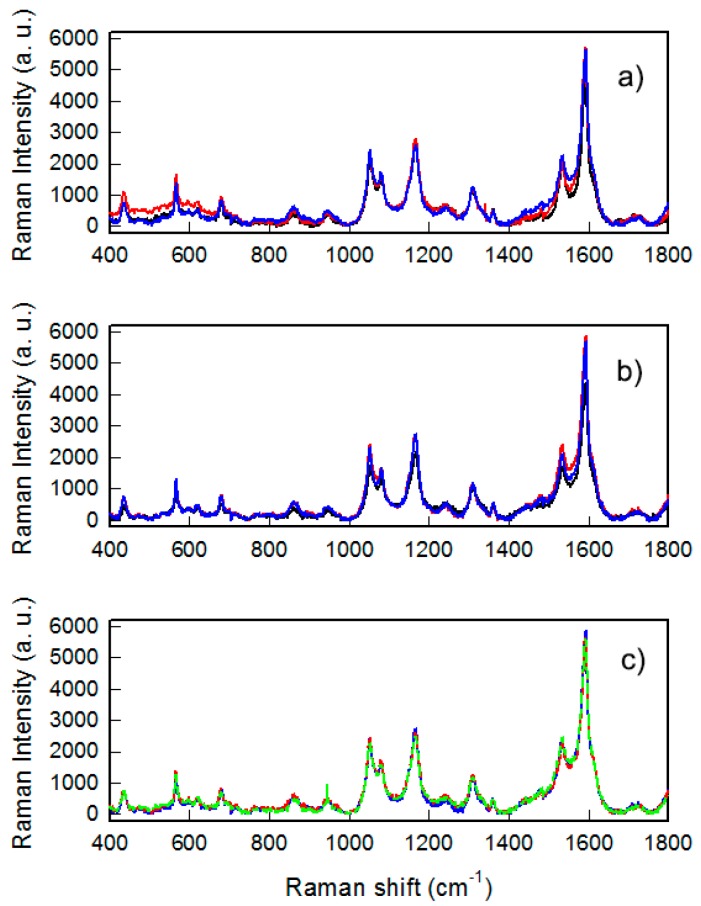
Figure 4.
Surface enhanced Raman spectroscopy (SERS) spectra of GNS layers coated with MMC: (a) Taken on three different samples; (b) taken on three points of the same sample and (c) taken on three different samples prepared using coating solution with different concentrations: 10−5 (green line), 10−4 (blue line) and 10−3 (red line).

