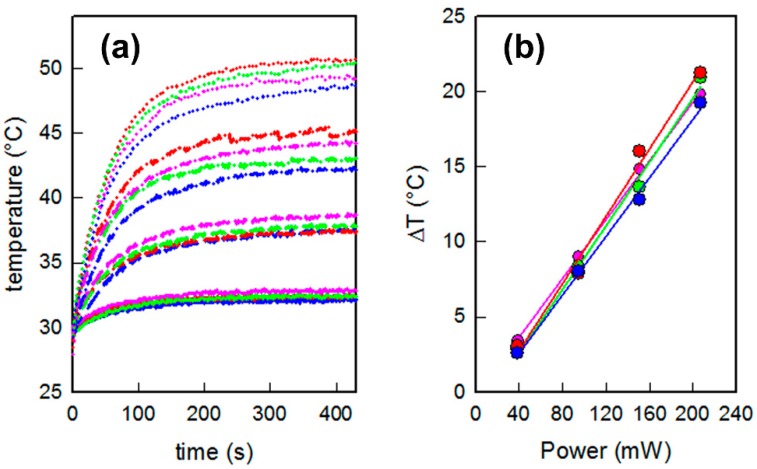
Figure 5.
(a) Temperature versus time thermograms obtained for different samples under laser irradiation at 808 nm with different power samples: 39 mW (solid lines), 95 mW (long dashed lines), 151 mW (dash-dot-dash lines) and 207 mW (dotted lines); and (b) maximum temperature increase reached by each sample vs. applied laser power. Blue lines/symbols: Uncoated GNS layers; red lines/symbols: 4-MBA coated GNS layers; green lines/symbols: 4-MPBA coated GNS layers; pink lines/symbols: 12C-SH coated GNS layers.

