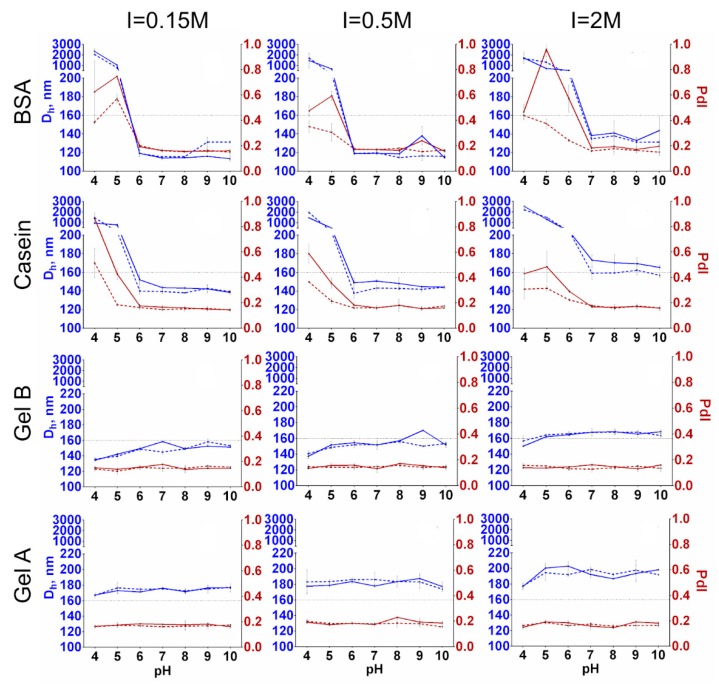
Figure 7.
Colloidal stability of Fe@C-NH2/Protein/G in buffers with different pH and ionic strength values. Ionic strength values are specified at the top of the figure. “BSA”, “Casein”, “Gel B”, and “Gel A” indicate coating protein. Blue line—hydrodynamic diameter at 0 (dashed line) and 24 h (solid line); orange line—polydispersity index at 0 (dashed line) and 24 h (solid line), n = 3, mean ± SD.

