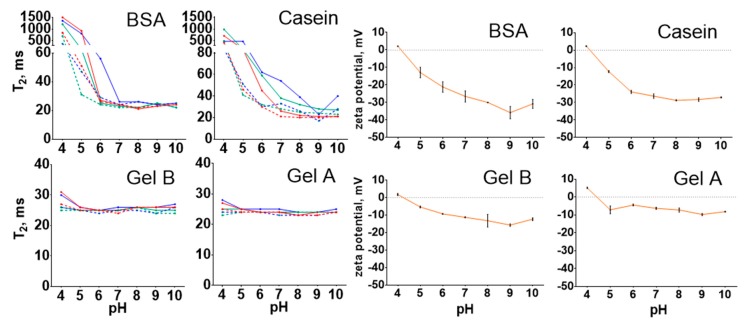
Figure 8.
The T2 relaxation times of Fe@C-NH2/Protein/G diluted in buffers with different pH and ionic strength values and the zeta potentials of Fe@C-NH2/Protein/G. “BSA”, “Casein”, “Gel B”, and “Gel A” indicate coating protein. T2 in 0.15 M (red line), 0.5 M (green line), and 2 M (blue line) buffers at 0 (dashed line) and 24 h (solid line), n = 3, mean ± SD.

