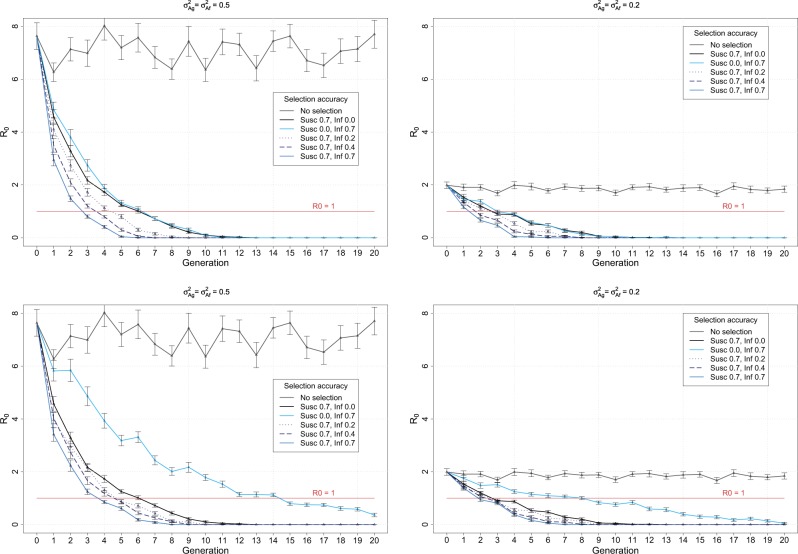
Fig. 3.
Change in the population realised R0 over generations of selection. The graphs show the change per generation in the population realised R0 for different genetic variances and selection intensities (Table 1). Upper row: 50% selection on sires for both susceptibility and infectivity, for the genetic variances of 0.5 (left panel) and 0.2 (right panel). Lower row: 50% selection on the sires for susceptibility and 80% selection on the sires for infectivity, for the genetic variances of 0.5 (left panel) and 0.2 (right panel). The vertical bars represent the standard errors over 50 replicates. The red line shows the R0 threshold value of 1

