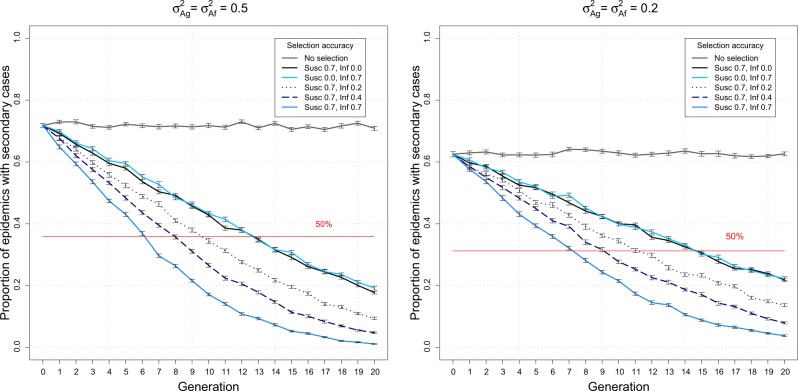
Fig. 4.
Proportion of epidemics with at least one secondary case over generations of selection. The graphs show the proportion of groups that resulted in at least one secondary case after introduction of an arbitrary infected index case, assuming a genetic variance of 0.5 (left panel), or 0.2 (right panel) (Table 1). The vertical bars represent the standard errors of the means over 50 replicates. The red line denotes the 50% benchmark

