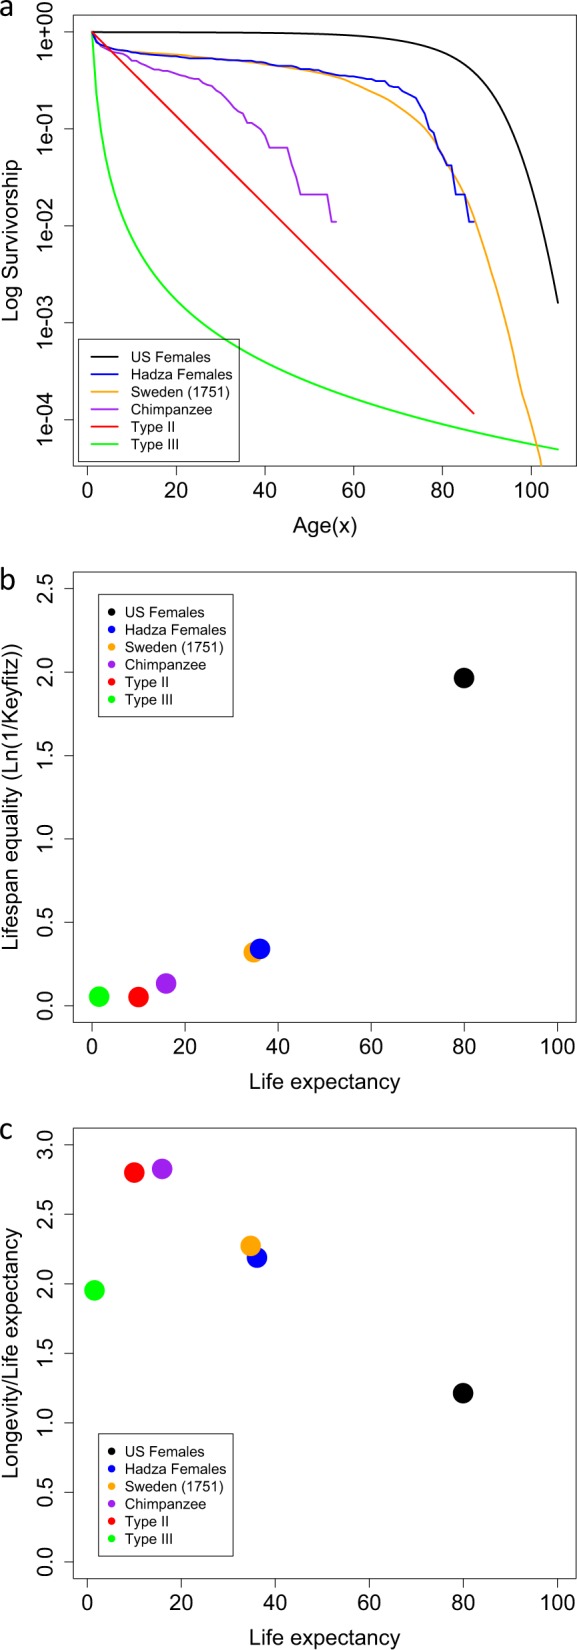
Fig. 1.

a Comparison of survivorship curves for six populations. The US females from 2000 (black, Templeton 2006) represent a Type-I population. The Swedish females from 1751 (orange, Human Mortality Database (http://www.mortality.org)) and Hadza females (blue, Blurton Jones 2016) represent Type-I populations prior to the increased longevity seen in modern populations. The wild Chimpanzee (purple, Bronikowski et al. 2016) represents our closest living species. The Type-II population (red, simulated (see Methods for details)) is used as a close approximation of the chimpanzee population and the Type-III population (green, simulated (see Methods for details)) is used for completion as a comparator at the other end of the ‘type’ spectrum. b A continuum of lifespan equality (ln(1/H)) and life expectancy in six populations presented in a. c A comparison of ‘pace’ (life expectancy) and ‘shape’ (ratio of longevity to life expectancy) for six populations in a
