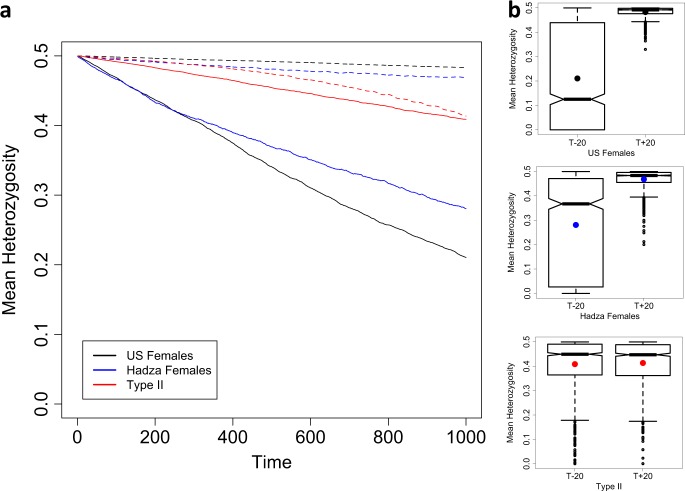
Fig. 4.
a Mean decline in heterozygosity from 1000 age-structured simulations where the starting frequency is PB = 0.5, N = 1000, where reproductive distributions have been shifted towards the young (T−20, solid lines) and the old (T+20, dashed lines). Time is in years. b Notched boxplots summarising each of the 1000 simulations run for each population. The black, blue and red dots indicate the means for the US, Hadza and Type-II populations, respectively

