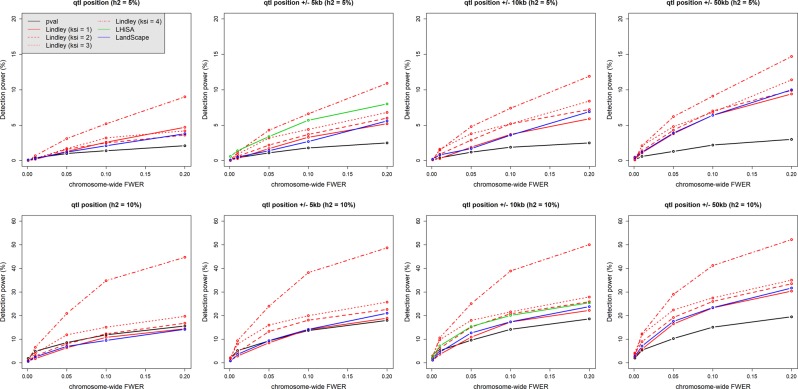
Fig. 3.
Minor QTL detection power by p-value-based tests (emmax method) and methods based on aggregation of p-values (Local Score, LHiSA, and LandScape). Two different QTL heritability values, 0.05 (top row) and 0.1 (bottom row), were each simulated 1000 times (see the simulation settings in the Materials and Methods section “QTL simulations”). The detection power was calculated as the proportion of simulations in which the simulated QTL was detected at a given chromosome-wide FWER set up using simulations of the “no QTL hypothesis.” Power estimation at the QTL position used the value of each statistic (−log10(p), Ak, and h) at the simulated QTL position, whereas estimations on windows of ±5, ±10, or ±50 kbp on both sides of the QTL position used the maximum of each statistic in the window. As LHiSA does not provide a marker-based statistic, rather the score H of the highest-scoring segment, power was calculated as the proportion of simulations in which the highest-scoring segment contained the QTL position and had an H-value superior to the significance threshold. In addition, as the highest-scoring segment had variable size across simulations, LHiSA power curves were compared with power curves of the other methods on windows thatwere the closest to the mean interval size given by LHiSA; i.e., 13,593 and 28,598 bp, for QTL heritability values of 0.05 and 0.1, respectively. This method penalizes the other local score methods, as we considered that the QTL was detected if the maximum in the considered window is higher than the detecting thresholds. Situations where the local score is higher than the threshold but is outside the window are not considered as cases of QTL detection, even if the QTL falls in the segment

