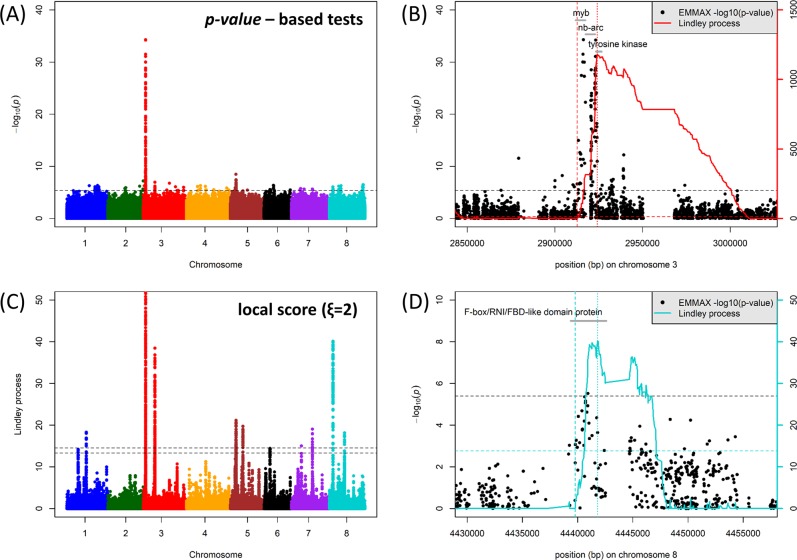
Fig. 5.
GWAS and local score analysis of M. truncatula PC1 parameter (Bonhomme et al. 2014) for quantitative disease resistance to A. euteiches isolate ATCC 201684. a Manhattan plot of the p-value-based tests (emmax) performed on the PC1 parameter. The horizontal dashed line indicates the significance threshold (4 × 10⁻⁶). b Magnification of the highest significant peak at the top of chromosome 3 at the MYB/NB-ARC/tyrosine kinase QDR locus. Gray segments indicate the different gene models in the region. The solid red curve indicates the Lindley process (local score method with ξ = 2) calculated from left to right and the two red dashed vertical lines indicate the interval detected, with the curve right of the peak not taken into account. The horizontal black and red dashed lines indicate the significance threshold (FWER = 20%) for p-value-based tests (4 × 10⁻⁶) and for the local score (13.92), respectively. c Manhattan plot of the Lindley process (local score method with ξ = 2). The two horizontal dashed lines indicate the minimum and maximum of the eight chromosome-wide significance thresholds. Note that the range of values on the y-axis is limited to 0–50 in order to highlight minor QDR loci, whereas the main association peak on chromosome 3 shows very high local score values (up to 1179: see Fig. 5b). d Magnification of the highest significant peak on chromosome 8 at the F-box/RNI/FBD-like domain protein. The legend is the same as in Fig. 5b, except that curves and lines relative to the Lindley process are highlighted in light blue

