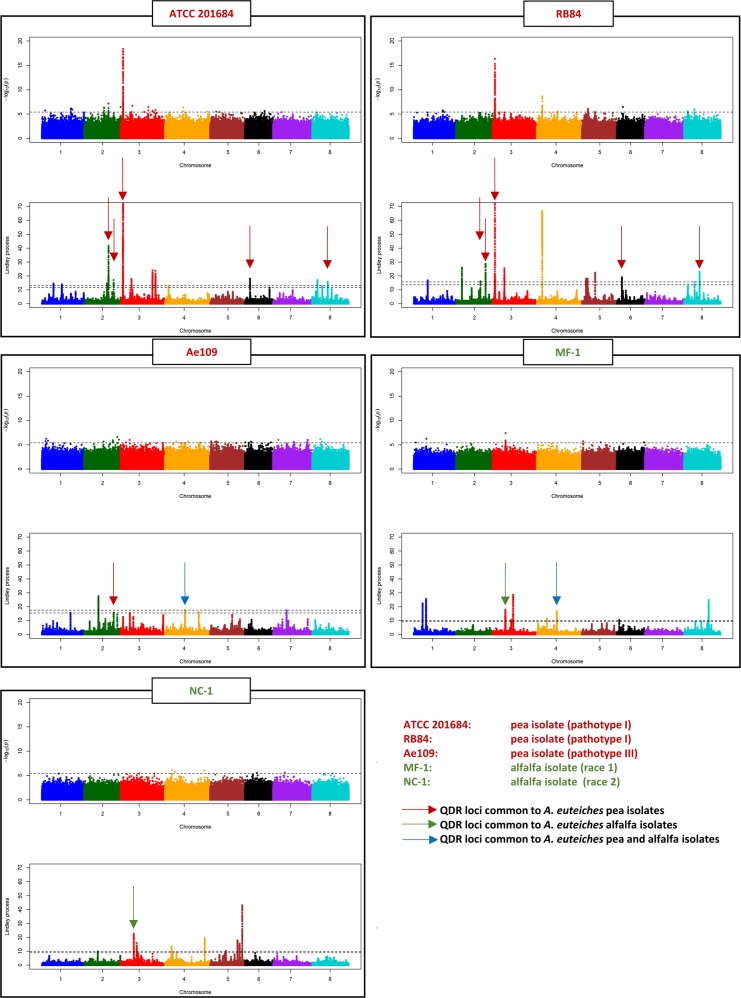
Fig. 6.
GWAS and local score analysis of M. truncatula Root Rot Index parameter for quantitative disease resistance to five A. euteiches isolates. Each box represents the Manhattan plots of the p-value-based tests (top) and the Lindley process (bottom) performed on M. truncatula RRI phenotypic parameter, in response to each of the five different A. euteiches isolates. The horizontal dashed line in each Manhattan plot of the p-value-based tests indicates the significance threshold (4 × 10⁻⁶). The two horizontal dashed lines in each Manhattan plot of the Lindley process indicate the minimum and maximum of the eight chromosome-wide significance thresholds. For the first two Manhattan plots of the Lindley process (QDR to isolates ATCC 201684 and RB84), the range of values on the y-axis is limited to 0–70 in order to highlight small-effect QDR loci outside of chromosome 3, on which the main association peak shows very high local score values (600 and 463 for ATCC 201684 and RB84, respectively; see Supplementary Table S1). Brown, green, and blue arrows highlight QDR loci (mainly identified using the local score approach), which are common to (i) A. euteiches pea isolates, (ii) A. euteiches alfalfa isolates, and (iii) A. euteiches pea and alfalfa isolates

