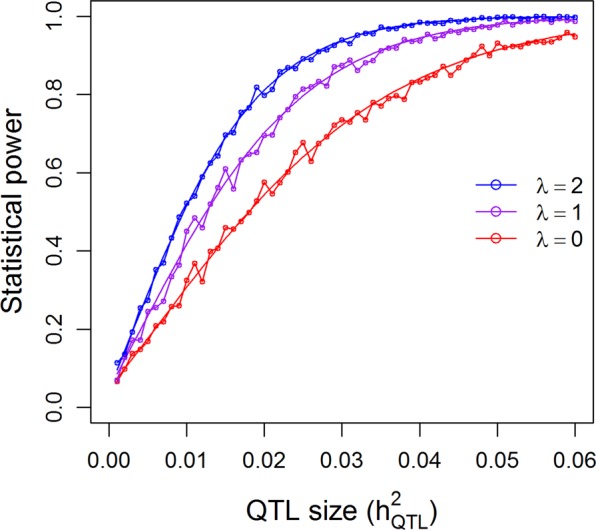
Fig. 4.

Comparison of the theoretical powers to the empirical powers from simulation studies using the kinship matrix of 210 recombinant inbred lines (RIL) of rice under the additive model. Smooth curves are theoretical power functions and fluctuated curves tagged with open circles are empirical power functions obtained from simulations. The power functions are evaluated under three levels of polygenic contribution represented by the ratios of the polygenic variance to the residual variance ()
