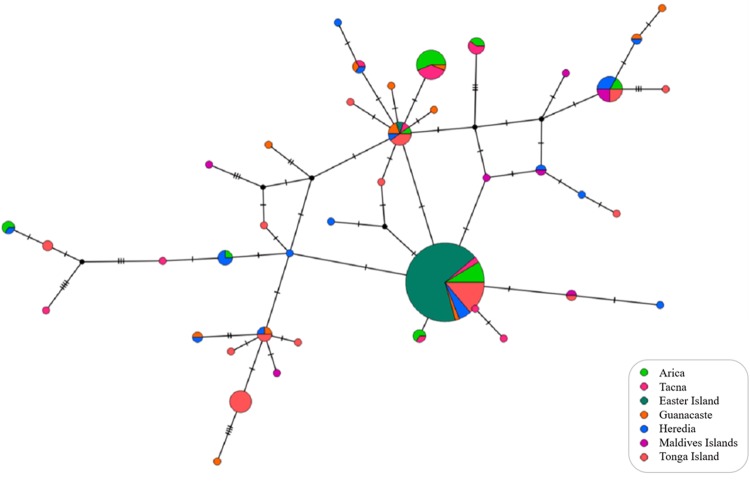
Fig. 3.
Median-joining network showing the relationship among COI haplotypes in Pantala flavescens. Circles represent haplotypes, with sizes proportional to their respective frequencies. Colors indicate the population origin of haplotypes. Tick marks represent the deduced number of nucleotide substitutions along each branch

