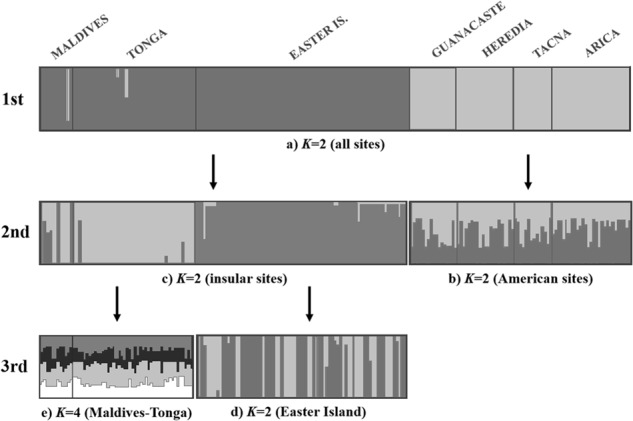
Fig. 4.

Hierarchical STRUCTURE analysis with three levels of subsets of populations separated and re-analyzed. Vertical lines separate individuals from seven sampling sites (labeled above). Each individual is represented by a thin horizontal line, which is partitioned into K-colored segments representing an individual’s estimated membership fractions in K clusters
