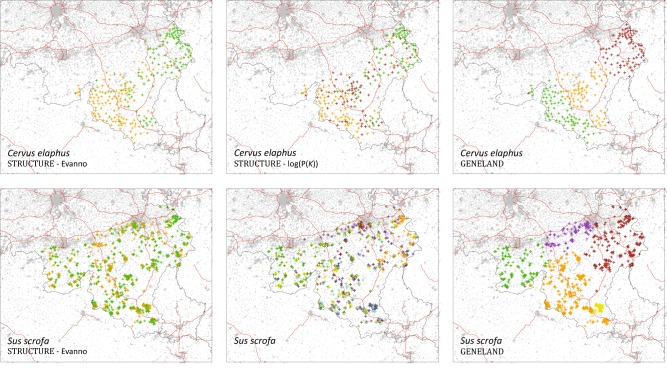
Fig. 2.
Results of the clustering analyses performed with STRUCTURE and GENELAND. One specific colour has been assigned to each individual and refers to the inferred cluster for which the individual has the highest percentage of membership. Grey areas and red lines respectively correspond to artificial areas and motorways (see also Figure S2)

