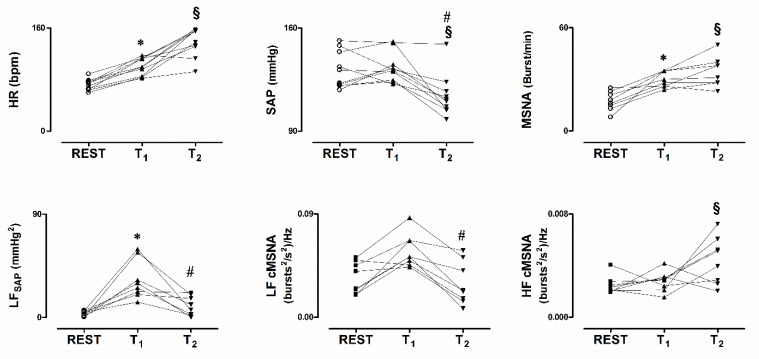
Figure 2.
Individual values of heat rate (HR), systolic arterial pressure (SAP) and MSNA while supine (REST), during asymptomatic 80° head-up tilt (T1) and during pre-syncope (T2), in the upper panels. In the lower panels values of the low frequency spontaneous oscillation of SAP (LFSAP) and MSNA variability (LFcMSNA) are depicted. Notice hypotension in the presence of persistently elevated HR and MSNA during T2. In addition, T2 was characterized by a decrease of the power of the low frequency components of both SAP and cMSNA variability. * p < 0.05 REST vs T1. # p < 0.05 T1 vs T2. § p < 0.05 REST vs T2.

