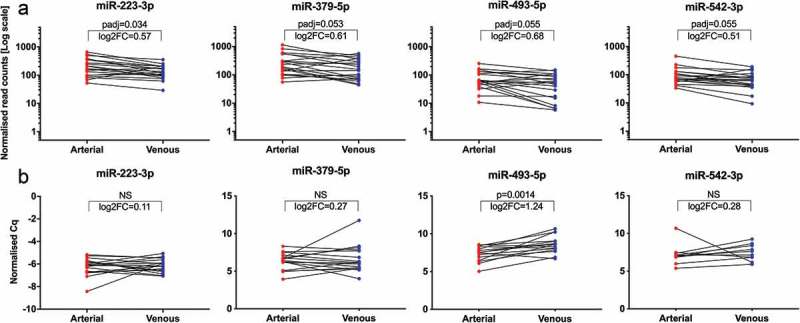
Figure 6.

Significantly regulated miRNAs from NGS and validation by RT-qPCR. Illustration of four miRNAs differentially regulated between arterial and venous crude samples from NGS (a). Normalised read counts were plotted for each paired arterial and venous specimen. Individual changes in miRNA expression are indicated by lines. All miRNAs displayed a slight overall tendency of higher expression in arterial samples, albeit with reversed trends for some patients. padj: adjusted p-value; log2FC: log2 fold change. Illustration of normalised Cq values from the subsequent RT-qPCR validation (b). Only miR-493-5p showed significantly higher expression in arterial samples. Specimens which did not proper amplify during RT-qPCR were removed from the data set, and only matched arterial and venous samples were included for analyses. miR-223-3p, n = 19; miR-379-5p, n = 17; miR-493-5p, n = 15; miR-542-3p, n = 10; NS: not significant.
