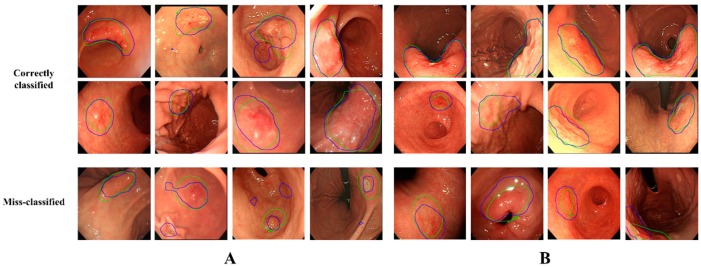
Figure 2.
Classification results of lesion-based VGG-16. The green lines indicate the actual early gastric cancer (EGC) regions. The blue lines indicate the activated regions at testing. The first two rows are images precisely classified to their own classes, whereas the last row shows misclassified images. (A) EGC detection. (B) EGC depth prediction.

