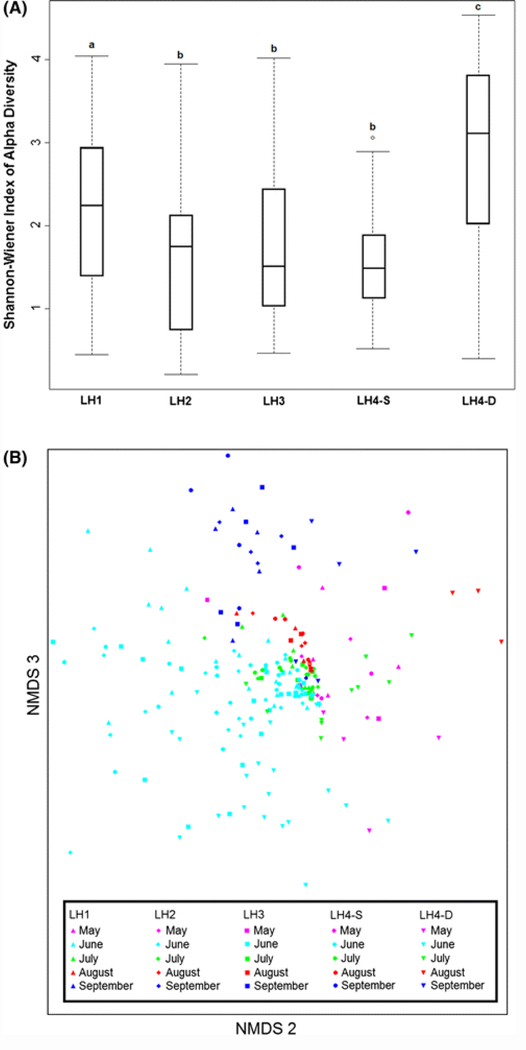
Fig. 2.

Alpha and beta diversity among lake samples. A Box-and-whisker plot comparing the Shannon–Wiener index values at each of the 5 sampling sites. B Reduced-space NMDS plot showing spatio-temporal variation in the planktonic community’s taxonomic composition based on Bray–Curtis dissimilarity (The best solution was a three-dimensional ordination; mean stress in relation to dimensionality = 11.823. Only dimensions 2 and 3 of the ordination are presented for illustrative purposes)
