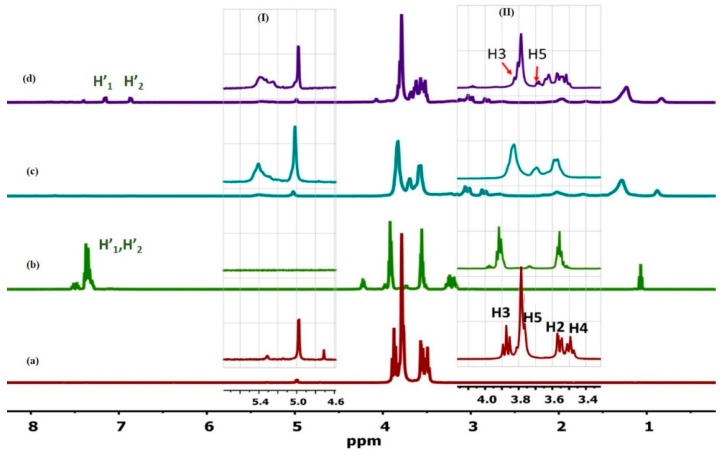
Figure 2.
1H NMR spectra of (a) βCD, (b) Mel, (c) 18:1βCDg, and (d) 18:1βCDg-Mel complex at 2:1 molar ratio obtained in D2O at 298 K. The insets show enlarged resonance regions for the alkenic signal (H11) of the gemini (I) and βCD signals (II). Some signals for the drug (H’1, H’2) and the interior and exterior protons of βCD are labeled.

