Fig. 1.
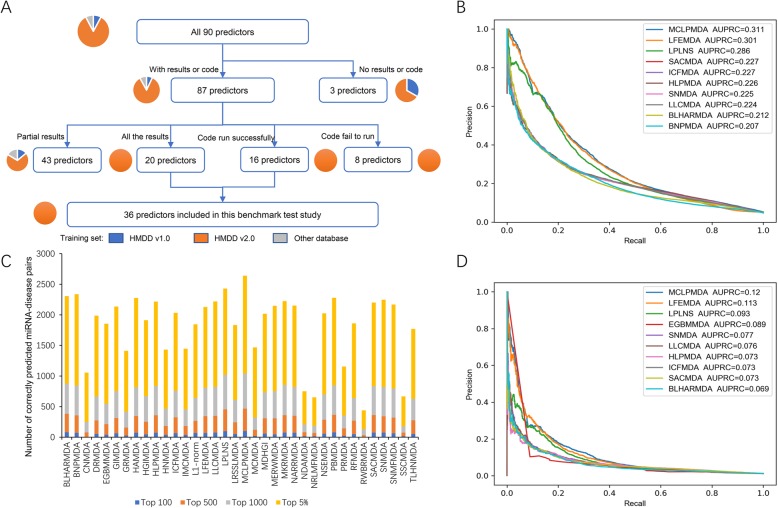
Overall performance of 36 miRNA-disease association predictors on the benchmarking datasets. a The flow chart depicting the inclusion/exclusion criterion for the predictors. The count of predictors included/excluded at each step is indicated by the number in the parentheses, and the fractions of predictors trained with different training datasets are depicted by the associated pie charts. b Precision-recall curves of the top ten predictors in terms of AUPRC on the ALL benchmarking dataset. c The statistics of correctly predicted miRNA-disease association pairs among the top 100, top 500, top 1000, and top 5% highly scored predictions on the ALL benchmarking dataset. d Precision-recall curves of the top ten predictors in terms of AUPRC on the CAUSAL benchmarking dataset

