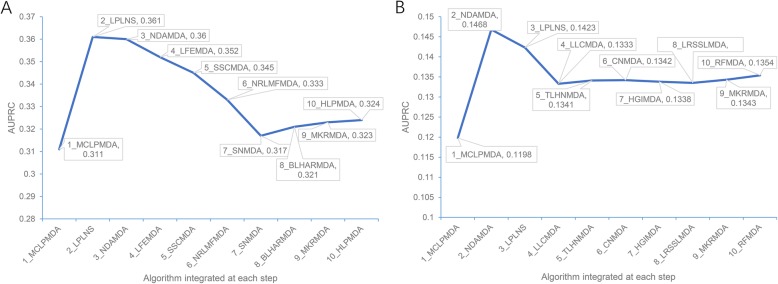
Fig. 2.
AUPRC improvement with iterative integration of different predictors. The combined predictors using the max-min prediction score normalization approach were tested on the ALL and the CAUSAL benchmarking datasets, respectively. The predictor integrated at each round of iteration and the AUPRC of the combined predictor are indicated on the line chart. a The AUPRC results of the combined predictors on the ALL benchmarking dataset. b The AUPRC results of the combined predictors on the CAUSAL benchmarking dataset

