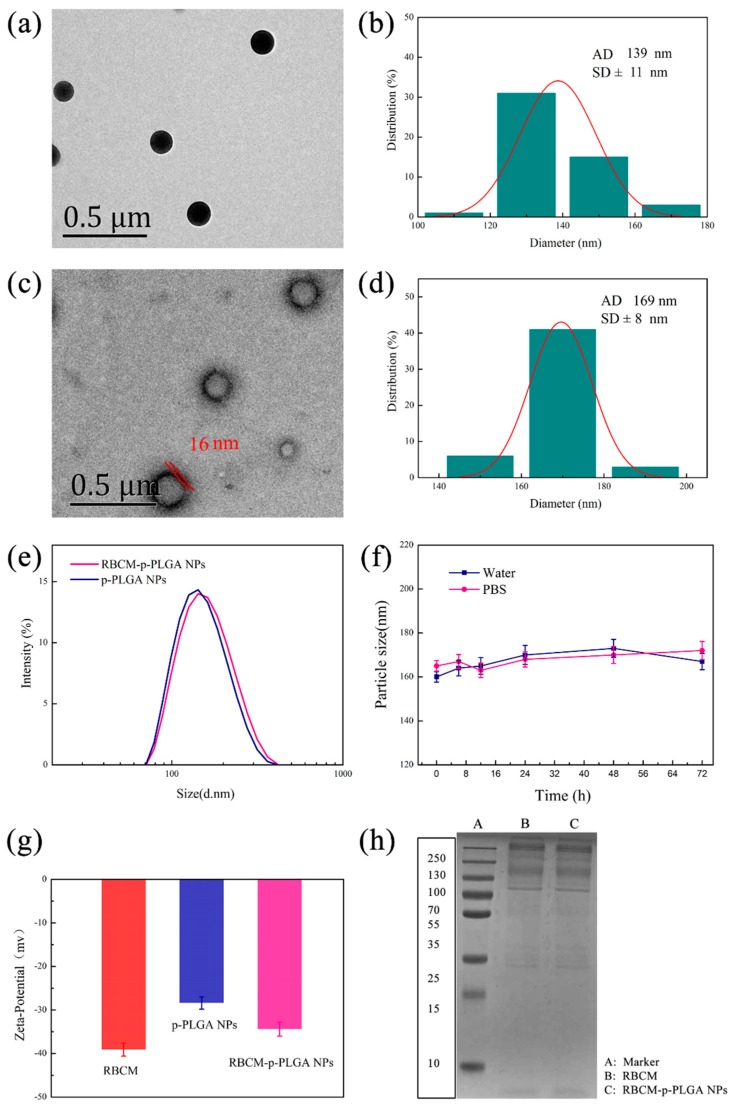
Figure 1.
Characterizing data for the NPs. TEM images are given of (a) p-PLGA NPs and (c) RBCM-p-PLGA NPs, together with (b,d) their respective size distributions and (e) dynamic light scattering (DLS) data. (f) The sizes of RBCM-p-PLGA@Cur NPs stored in water and PBS, as determined by DLS. (g) Zeta-potential data. (h) SDS-PAGE analysis of RBCM and the RBCM-p-PLGA NPs. In (f,g) data are shown as mean ± S.D. (n = 3).

