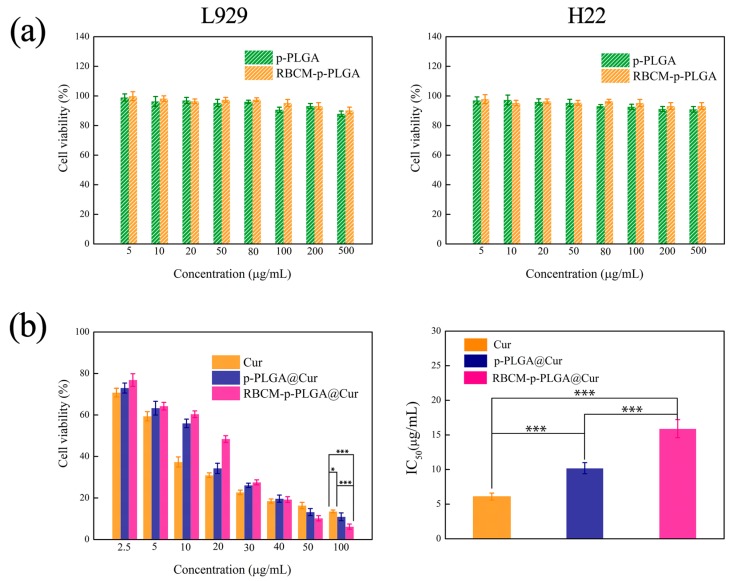
Figure 3.
MTT viability data for (a) L929 cells and H22 cells treated with p-PLGA and RBCM-p-PLGA; (b) H22 cells treated with free Cur, p-PLGA@Cur NPs and RBCM-p-PLGA@Cur NPs. Data are presented as mean ± S.D. (n = 9). Statistical significance is denoted as * p < 0.05, ** p < 0.005 and *** p < 0.001.

