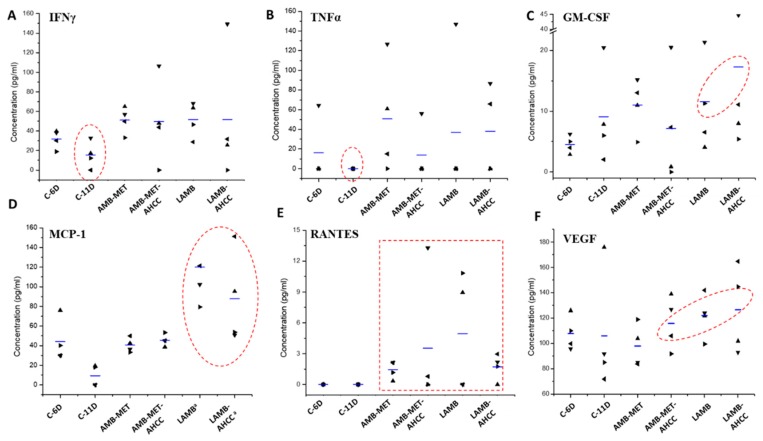
Figure 3.
Scattergram of cytokine levels at day 6 and 11 for control group and at day 11 post-infection for all treatment groups. Horizontal lines indicate mean values of (A) IFNγ, (B)TNFα, (C) GM-CSF, (D) MCP-1, (E) RANTES, (F) VEGF. Key: C-6D, control group at day six post-infection, C-11D, control group at day 11 post-infection, AMB-MET, and AMB-MET-AHCC, treatment with AMB encapsulated within GCPQ nanoparticles alone or in combination with AHCC® respectively, LAMB and LAMB-AHCC, treatment with i.v. liposomal AMB alone or in combination with AHCC® respectively. The most relevant changes in the cytokine patterns have been highlighted within a red circle. a P < 0.05.

