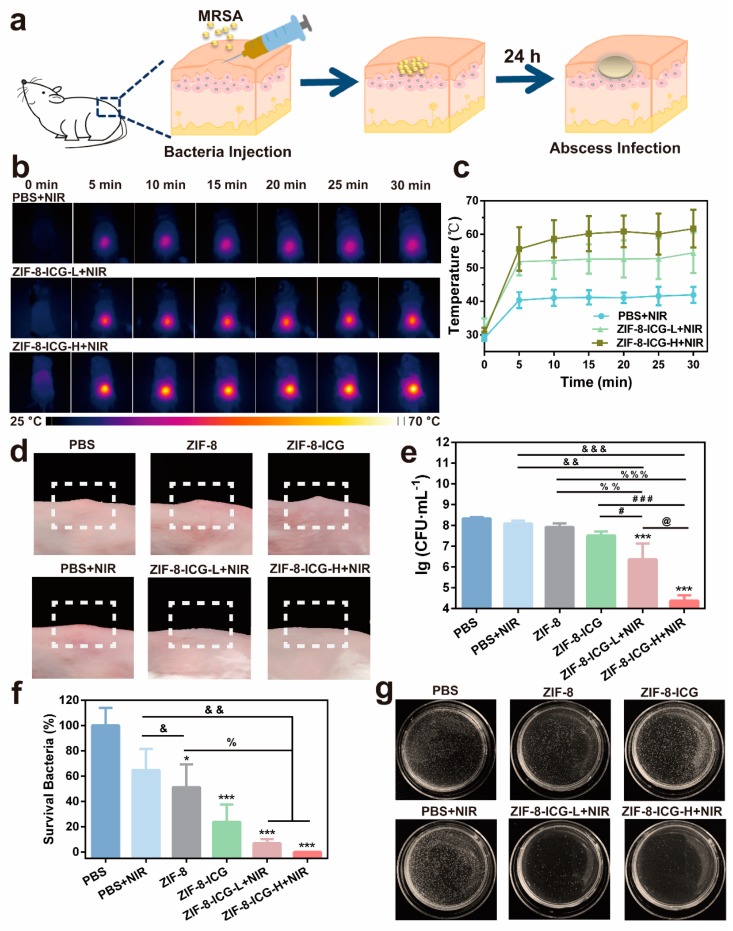
Figure 7.
(a) Schematic illustration of the mice modeling process by local injection; (b) The thermographic images of MRSA-infected mice under 808 nm laser irradiation at 0, 5, 10, 15, 20, 25, and 30 min post-administration; (c) Local temperature profiles of laser treated mice at different time points; (d) Digital photographs of the infected skin surface after different treatments; (e) Microbial burden after different treatments in murine models of skin; (f) Bacterial viability of MRSA after different treatments. * p < 0.05 vs. PBS; *** p < 0.001 vs. PBS; & p < 0.05 vs. PBS+NIR; && p < 0.01 vs. PBS+NIR; &&& p < 0.001 vs. PBS+NIR; % p < 0.05 vs. ZIF-8; %% p < 0.01 vs. ZIF-8; %%% p < 0.001 vs. ZIF-8; # p < 0.05 vs. ZIF-8-ICG; ### p < 0.001 vs. ZIF-8-ICG; @ p < 0.05 vs. ZIF-8-ICG-L+NIR; (g) Photographs of MRSA colonies in the agar plates.

