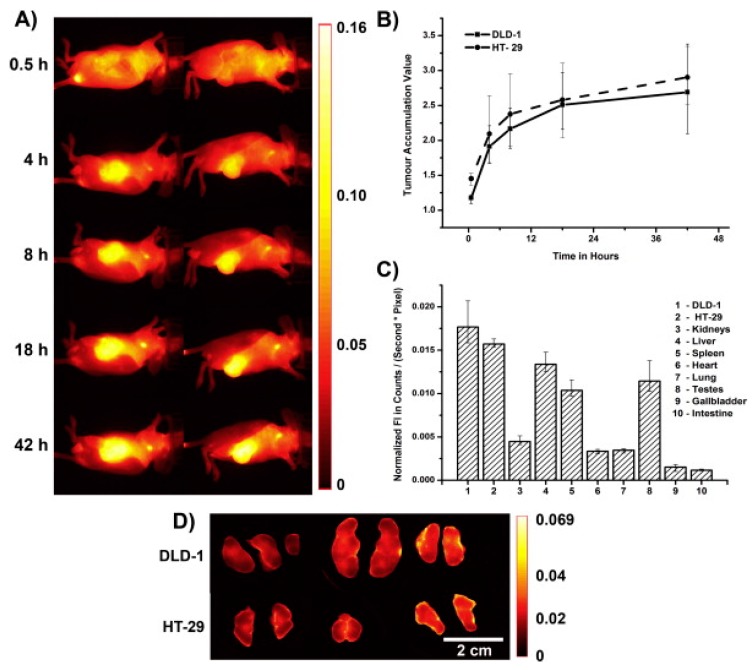
Figure 7.
(A) In vivo images of colon carcinoma xenograft-bearing mouse after injection of 1.5 mg hydroxyethyl starch (HES) 450 kDa labeled with near infrared dye IR800CW. Left: HT-29, right DLD-1. (B) A comparable tumor accumulation value was calculated from the images for both tumors. (C) The fluorescence intensity measured from organs that were extracted 2 days after injection of HES 450. (D) Ex vivo images of autopsied xenograft colon carcinomas from 3 mice 2 days after injection of HES 450. Reprinted with permission from [87], Copyright [2013], Elsevier. Nevertheless, even the TAV calculation does not provide an absolute quantification. Values for the absolute intensities of fluorescent light have too many factors to be taken into account and may require additional studies. Such factors, encompassing the properties of particular DDS, the unique behavior of individual animals, and technique-independent parameters that influence the measured fluorescence intensity, among others, have been detailed in [5]. The detection of in vivo fluorescent signals for DDS in animal models for cancer therapy is quite easy using readily available instruments for fluorescence imaging if some basic conditions are considered. Regarding quantification, relative comparisons are possible. However, great care must be taken to achieve reliable absolute quantification. Some examples of DDS used in FRI are presented below.

