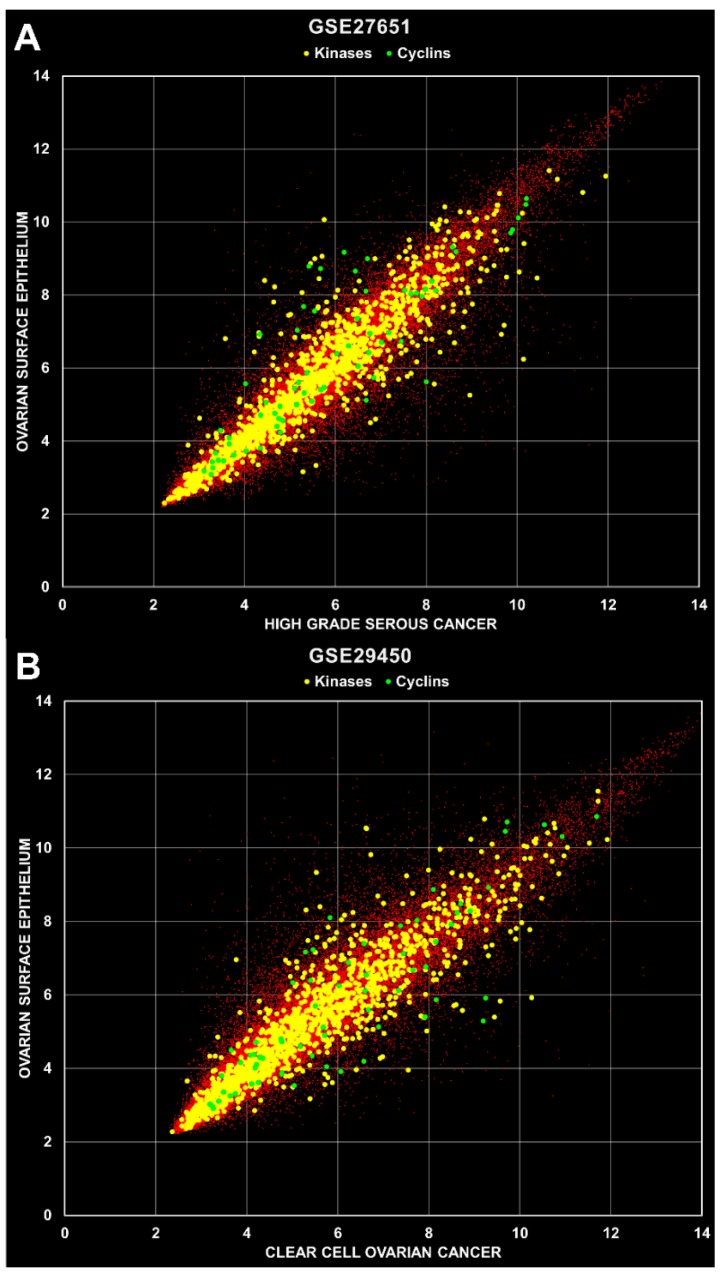
Figure 2.
Scatter plots of microarray data. (A) Mean values were calculated from replica groups (HOSE 6 samples; HGSOC 22 samples) and plotted against each other as indicated with axis names. The R2 values were 0.8877, 0.8547 and 0.7522 for total, kinases and cyclins, respectively. (B) Mean values were calculated from 10 HOSE and 10 CCOC samples. The R2 values were 0.8577, 0.8406 and 0.7489 for total, kinases and cyclins, respectively.

