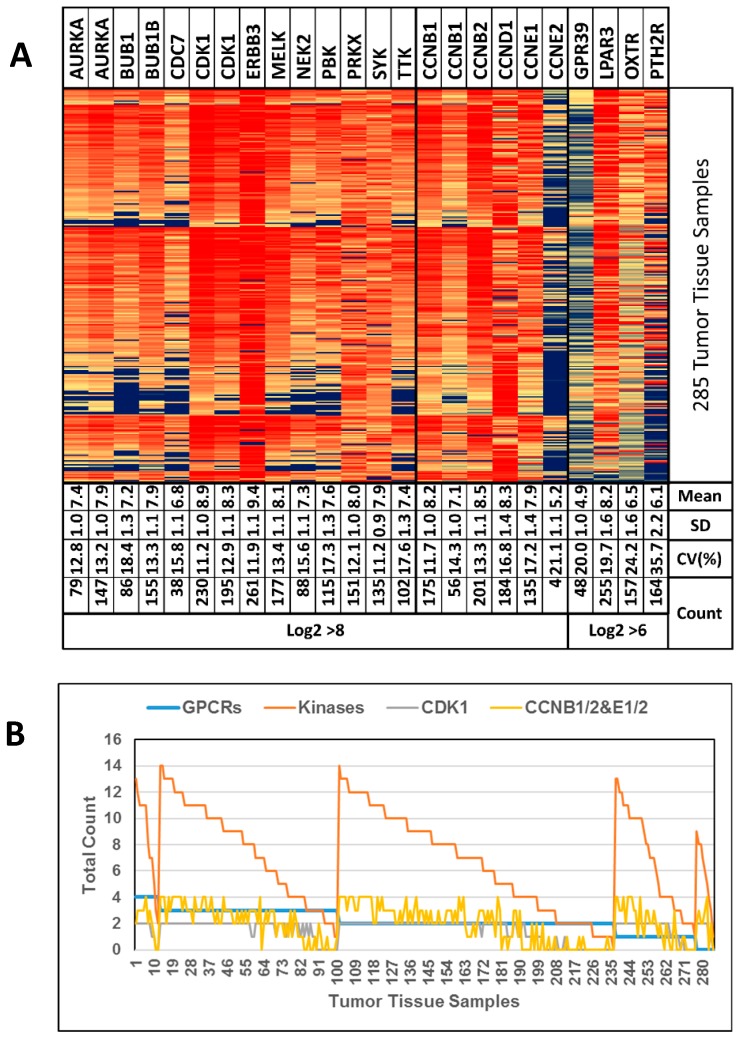
Figure 4.
(A) Heat map of GSE9891 data. “Mean” values indicate Log2 intensities. “Count” values indicate the number of samples (out of 285 samples) with a Log2 intensity of >6 or >8, respectively. Genes AURKA, CDK1 and CCNB1 appear twice to show the data from 2 different DNA probes available. (B) Tumor tissue samples ordered according to the number of GPCRs with Log2 > 6 (blue line) followed by ordering them by the number of kinases with Log2 > 8 (orange line). CDK1 and CCNB1/2 are shown separately (grey and yellow line, respectively, see text for explanation). Genes with data from 2 DNA probes were looked at and counted individually.

