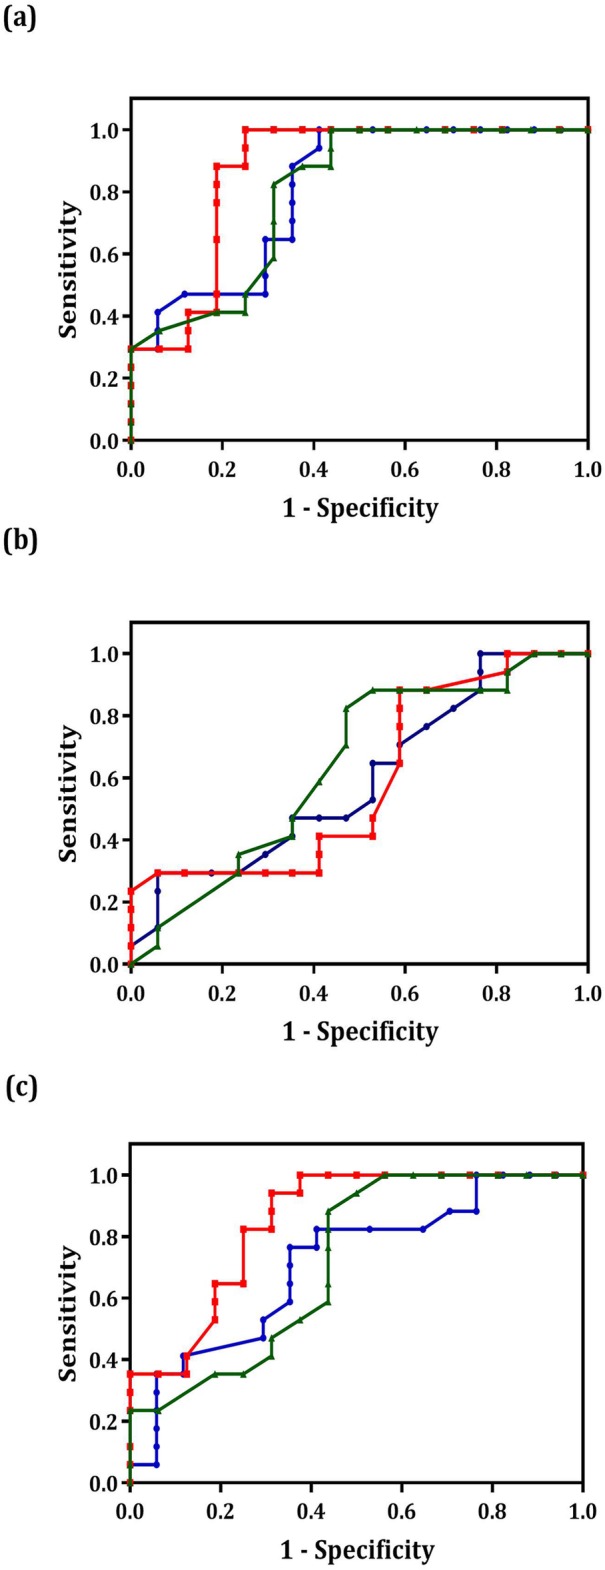
Fig. 2.

ROC curve analysis using miR-9, miR-192 and miR-205 to distinguish the different groups in the tissue samples. The area under the curve (AUC) values in the cervical cancer and normal groups (a), the AUC values in the precancer and normal groups (b) and The AUC values in the cervical cancer and precancer groups (c). The red, blue and green lines represent miR-192, miR-9 and miR-205, respectively
