Fig. 1.

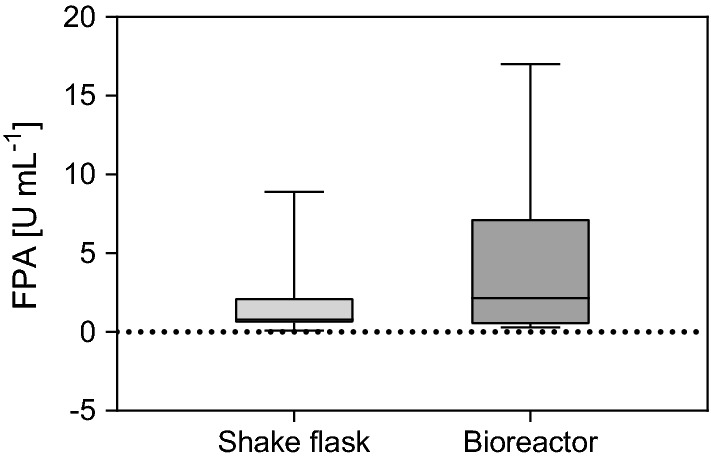
Box-and-whiskers plot for cellulase production in shake flask (n = 37) and bioreactor (n = 16) cultivations by T. reesei. Depicted are the min to max box plots in quartiles. The band inside the box represents the median

Box-and-whiskers plot for cellulase production in shake flask (n = 37) and bioreactor (n = 16) cultivations by T. reesei. Depicted are the min to max box plots in quartiles. The band inside the box represents the median