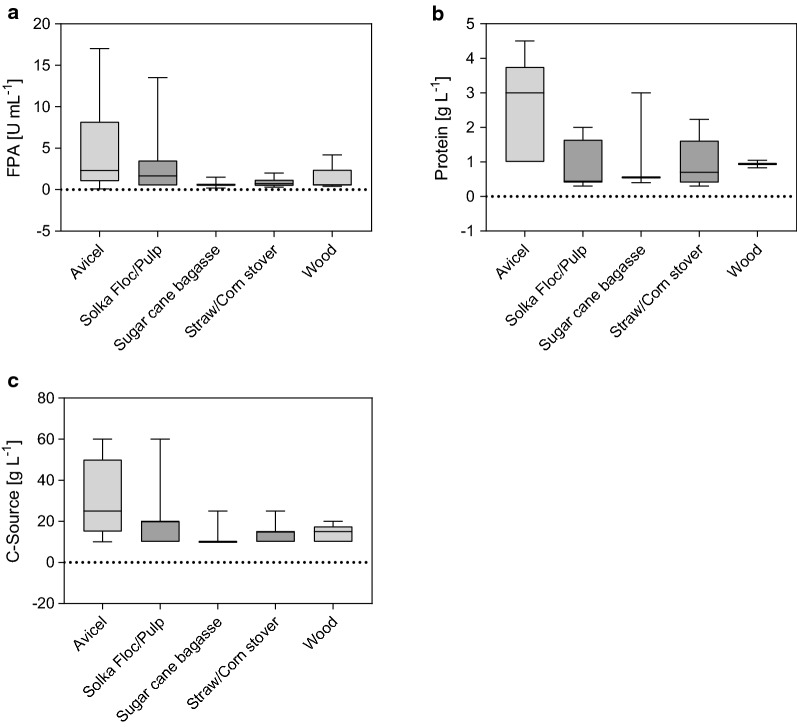
Fig. 3.
The influence of substrate type on FPA production (a), protein production (b), and C-source concentration utilized (c). The categories were ordered with ascending complexities from left to right, where the complexity is a function of the structural organization, the chemical composition, and the recalcitrance to deconstruction (as detailed in “Assessing and categorizing lignocellulosic biomass” section). Depicted are the min to max box plots in quartiles. The band inside the box represents the median. The raw data with the respective references can be found in Additional file 1: Table S1

