Figure 1.
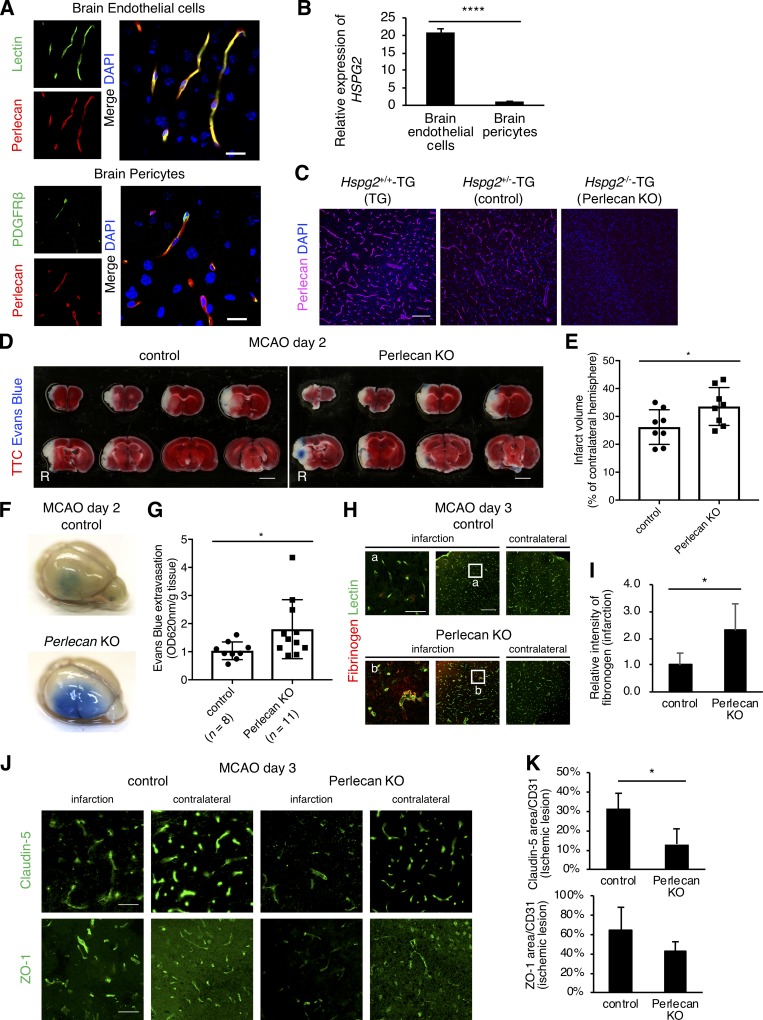
The BBB is strongly disrupted after ischemic stroke in Perlecan KO mice. (A) The expression of perlecan (red) colocalized with lectin-positive brain endothelial cells (green, upper panels) and was found adjacent to PDGFRβ-positive brain pericytes (green, lower panels) in a brain section of wild-type mice. Scale bar = 20 µm. (B) Quantitative PCR for HSPG2 (Perlecan) in cultured brain endothelial cells and pericytes. Values are mean ± SD; n = 4; ****, P < 0.0001, unpaired t test. (C) Perlecan was expressed in brain vasculature in Hspg2+/+-TG (TG) and Hspg2+/−-TG (control) mice, but not in conditional perlecan-deficient (Hspg2−/−-TG [Perlecan KO]) mice. Scale bar = 100 µm. (D and E) Representative images of TTC staining (D) at PSD 2 after MCAO in control and Perlecan KO mice and the quantified infarct volume (E). Evans Blue was injected into these mice to show the BBB leakage (Evans Blue extravasation). Scale bar = 3 mm. The infarction volume was significantly greater in Perlecan KO mice than in control mice. Values are mean ± SD; n = 8 mice per group; *, P < 0.05, unpaired t test. (F and G) Representative images of Evans Blue extravasation at PSD 2 after MCAO in control and Perlecan KO mice (F). Quantification of Evans Blue extracted from ipsilateral hemispheres at PSD 2 (G) showed more leakage of the dye in Perlecan KO mice than in control mice. Values are mean ± SD; n = 8–11 mice per group; *, P < 0.05, unpaired t test. (H and I) Representative images of fibrinogen extravasation at PSD 3 after MCAO in control and Perlecan KO mice. Left panels show a higher magnification of the indicated lesion in the infarction. Scale bar = 40 µm (left panels) or 150 µm (middle and right panels). Quantification of fibrinogen intensity (I) showed more leakage in Perlecan KO mice than in control mice. Values are mean ± SD; n = 5 mice per group; *, P < 0.05, unpaired t test. (J and K) Representative images of the immunostaining for Claudin-5 (upper panels) and ZO-1 (lower panels) at PSD 3 after MCAO in the brain cortex of control and Perlecan KO mice (J). Scale bar = 50 µm. Claudin-5–positive and ZO-1–positive areas were quantified and standardized by CD31-positive areas in the ischemic lesions of control and Perlecan KO mice (K). Values are mean ± SD; n = 4 mice per group; *, P < 0.05, unpaired t test.

