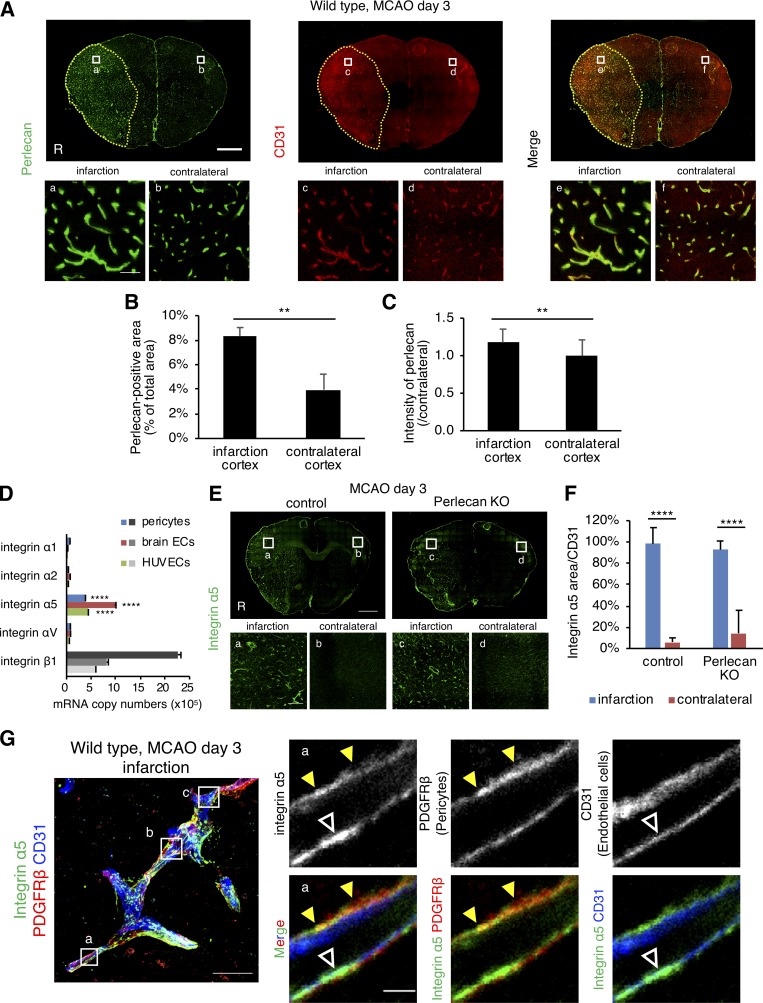
Figure 3.
The expression levels of perlecan and integrin α5 are increased after ischemic stroke. (A–C) The expression of perlecan (green) and CD31 (red) was significantly higher in the infarct areas than in the contralateral hemisphere at PSD 3 after MCAO. Scale bar = 1 mm (upper panels) or 50 µm (lower panels). Yellow dotted line = infarct area. Perlecan-positive areas (B) and the intensity (C) were quantified in brain cortex areas of wild-type mice. Values are mean ± SD; n = 5; **, P < 0.01, unpaired t test. (D) Quantitative real-time PCR for the expression of integrins in brain pericytes, brain endothelial cells (ECs), and human umbilical vein endothelial cells (HUVECs). Values are mean ± SD; n = 3; ****, P < 0001 versus other integrin α isoforms, one-way ANOVA followed by Tukey–Kramer’s HSD test. (E and F) The expression of integrin α5 was significantly increased compared with the contralateral hemisphere at PSD 3 after MCAO in control and Perlecan KO mice. Scale bar = 1 mm (top panel) or 100 µm (bottom panels). Integrin α5–positive areas were quantified in brain cortex areas (F). Values are mean ± SD; n = 6 mice per group; ****, P < 0001, one-way ANOVA followed by Tukey–Kramer’s HSD test. (G) Representative images of the immunostaining for integrin α5 in brain microvessels. A maximum-intensity projection image was constructed from Z-stack images (left panel). The boxed regions in the left panel are magnified in right panels (a) and in Fig. S3 C (b and c). The expression of Integrin α5 (green) was detectable in both pericytes (PDGFRβ, red, yellow arrowheads) and endothelial cells (CD31, blue, white arrowheads). Scale bar = 20 µm (left panel) or 2 µm (right panels).

