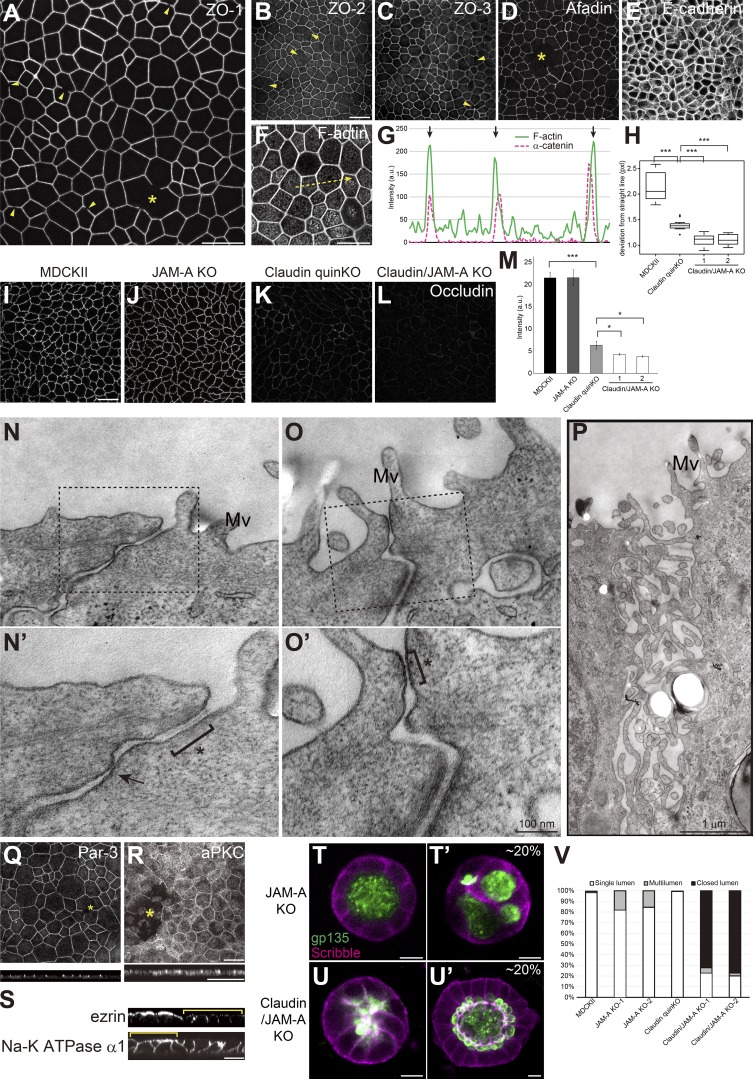
Figure 10.
JAM-A regulates membrane appositions and epithelial polarity in claudin quinKO cells. (A–M) Immunofluorescence analyses of cell junction proteins in claudin/JAM-A KO cells. (A) Discontinuity in ZO-1 staining is observed (arrowheads), and large gaps of ZO-1 were occasionally found (asterisk). (B–E) Discontinuity (arrowheads) and gaps (asterisk) were also observed for ZO-2 (B), ZO-3 (C), and Afadin (D) in claudin/JAM-A KO cells. E-cadherin (E) staining was continuous, suggesting that cell–cell contact is maintained. (F and G) F-actin staining shows thickening of circumferential actin bundles. Apical confocal sections are shown. Line scans represent the fluorescent intensity along the yellow arrow in F, and black arrows in G represent the position of cell junctions. (H) Linearity of cell junctions were quantified by measuring the length of deviation from a straight line drawn between the vertices of the corresponding cell junction. Cell junctions of claudin quinKO cells were straighter than MDCK II cells, and extremely straight in claudin/JAM-A KO cells. Graphs represent mean ± SD (n = 15 each). (I–L) Occludin immunostaining was reduced in claudin quinKO cells, and further reduced in claudin/JAM-A KO cells. (M) Quantitation of the fluorescence intensity of occludin. Graphs represent mean ± SD (n = 3 each). Data for MDCK II and claudin quinKO are identical to Fig. 2 F. (N–P) Transmission EM analyses of ultrathin sections of claudin/JAM-A KO cells. Black squares indicate the regions shown in high-magnification images. Intercellular spaces were open in claudin/JAM-A KO cells, and AJ-like structures were found (asterisk). Focal membrane appositions were found in some cases (arrow). Occasionally, apical cell junctions were not formed, and microvilli-like structures were observed along the lateral membranes (P). Mv, microvilli. (Q and R) Large gaps (asterisks) were occasionally observed in Par-3 (Q) and aPKC (R) staining. (S) Sporadic epithelial polarity defects were observed in claudin/JAM-A KO cells (yellow brackets), where ezrin was mislocalized to the lateral cell junctions, and Na-K ATPase α1 subunit was found on both apical and basolateral membranes. (T and U) Localization of apical marker gp135 (green) and basolateral marker Scribble (magenta) in JAM-A KO cells (T) and claudin/JAM-A KO cells (U) embedded in collagen I gels and cultured for 5–7 d. Multilumen phenotypes were observed in ∼20% of the cysts formed by JAM-A KO cells (T′). Majority of the cysts formed by claudin/JAM-A KO cells showed closed lumen phenotypes (U), while ∼20% of them had single lumens, although the lumen morphology was abnormal (U′). (V) Quantitation of cyst phenotypes (n = 343 for MDCK II, n = 398 for JAM-A KO-1, n = 502 for JAM-A KO-2, n = 752 for claudin quinKO, n = 970 for claudin/JAM-A KO-1, n = 1186 for claudin/JAM-A KO-2). Data for MDCK II and claudin quinKO are identical to Fig. 7 E. *, P < 0.05; ***, P < 0.0005. See Figs. 1, 2, 3, 6, 7, and 9 for control images. Scale bars: 20 µm (A–L and Q–S); 100 nm (N and O); 1 µm (P); 10 µm (T and U).

