Figure 2.
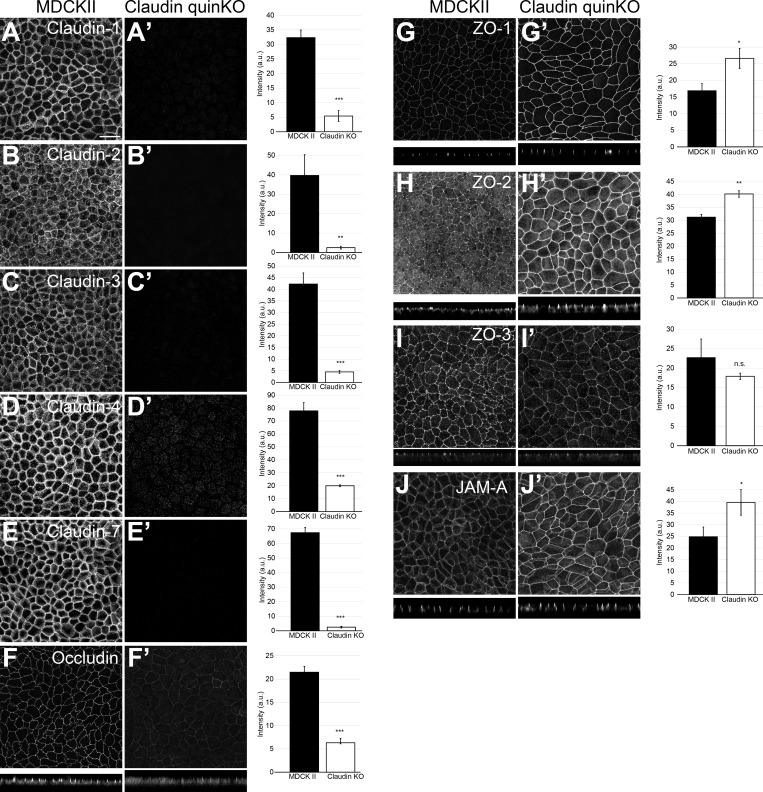
Localization of TJ proteins in claudin quinKO cells. (A–J) Immunofluorescence analyses of parental MDCK II cells (A–J) and claudin quinKO cells (A′–J′). (A–E) Claudin-1 (A), claudin-2 (B), claudin-3 (C), claudin-4 (D), and claudin-7 (E) expression was abolished in claudin quinKO cells. (F) Occludin localization to apical junctions was reduced. (G–I) ZO-1 (G) and ZO-2 (H) were more concentrated at apical junctions, while ZO-3 (I) localization was not altered in claudin quinKO cells. (J) JAM-A was more concentrated at apical junctions in claudin quinKO cells. Graphs are quantitation of the fluorescence intensity and represent mean ± SD (n = 3 each). *, P < 0.05; **, P < 0.005; ***, P < 0.0005, compared by t test. Scale bar: 20 µm. n.s., not significant.

