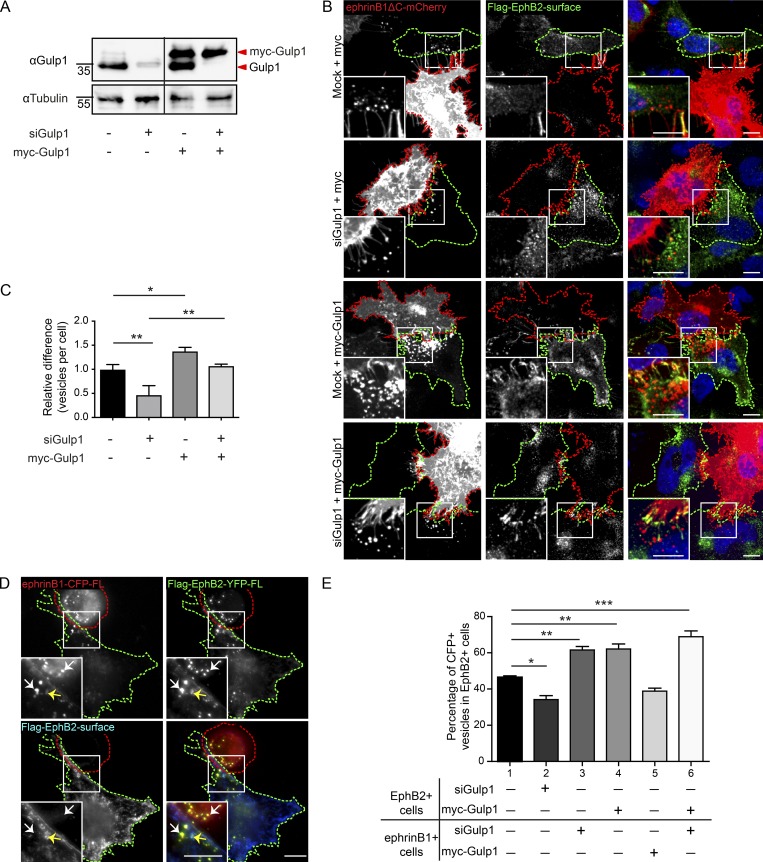
Figure 2.
Gulp1 regulates EphB2/ephrinB1 trogocytosis. (A) Western blot analysis shows efficient knockdown of endogenous Gulp1 expression and overexpression of siRNA-resistant myc-Gulp1 in HeLa cells. (B and C) Representative images (B) and quantification (C) showing Gulp1 is required for forward trogocytosis in HeLa cells. Responder cells (green dashed line) were treated with either mock or Gulp1 siRNA, then overexpressed with Flag-EphB2 and either siRNA-resistant myc-Gulp1 or myc as a control, before coculture with ephrinB1ΔC-mCherry+ donor cells (red dashed line). To determine internalized vesicles (red puncta), surface clusters (yellow puncta) were detected by antibody staining against Flag-EphB2 without permeabilization. Scale bars, 10 µm. Quantification results shown as mean ± SEM (n = 3 independent experiments, 6–12 responder cells per condition per experiment). Data normalized to median mock value per experiment. *, P < 0.05; **, P < 0.01; one-way ANOVA with Tukey’s multiple comparisons test. (D and E) Representative images (D) and quantification (E) showing manipulation of Gulp1 expression levels changes the preference of bi-directional EphB2/ephrinB1 trogocytosis in HeLa cells. Bi-directional trogocytosis was induced by coculturing Flag-EphB2-YFP+ cells (green dashed line) with ephrinB1-CFP+ cells (red dashed line). Combinations of Gulp1 knockdown and Gulp1 overexpression were set up as shown in E. White arrows indicate internalized vesicles (yellow puncta), and yellow arrows indicate surface clusters (blue puncta). Scale bars, 10 µm. The total pool of internalized YFP+/CFP+ vesicles within two opposing cells was counted, and the percentage of vesicles in EphB2+ cells (forward trogocytosis) was shown in the figure. The percentage of vesicles in ephrinB1+ cells (reverse trogocytosis) would be 100% minus the percentage of vesicles in EphB2+ cells (not shown). Results shown as mean ± SEM (n = 3 independent experiments, 6–11 responder-donor pairs per condition per experiment). *, P < 0.05; **, P < 0.01; ***, P < 0.001; one-way ANOVA with Tukey’s multiple comparisons test.

