Figure 7.
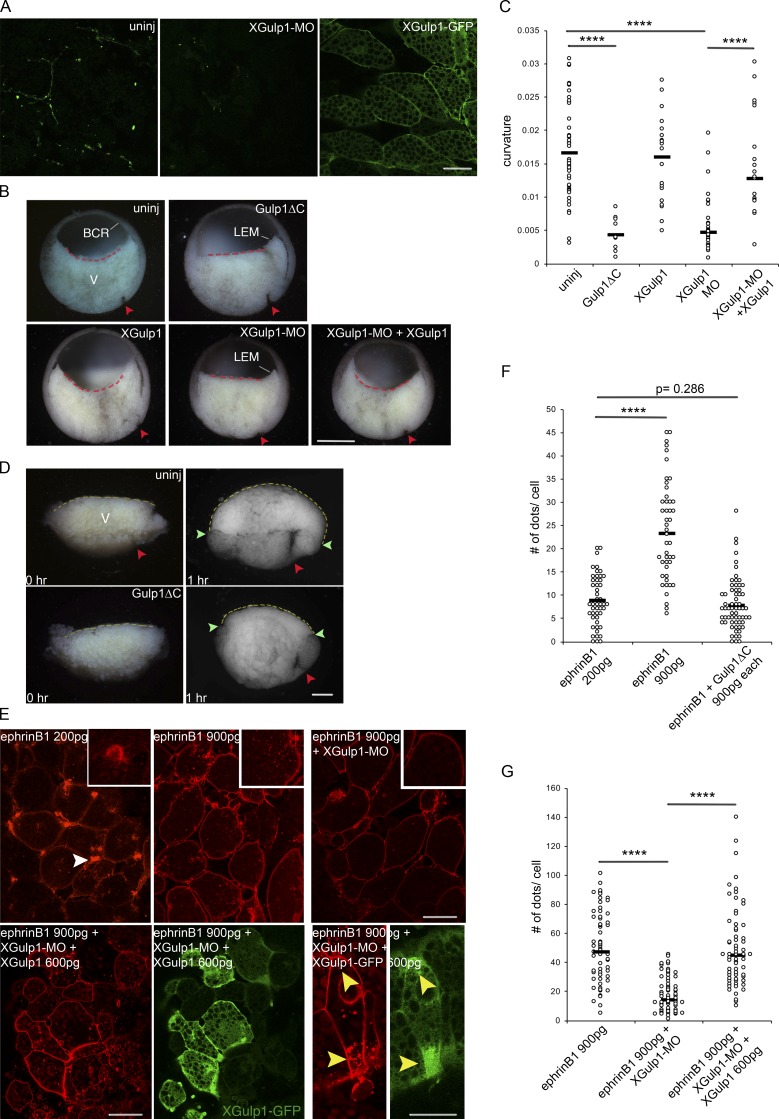
Role of Gulp1 in Xenopus gastrulation. (A) Expression of XGulp1 protein in vegetal cells. Anti-Gulp1 antibody staining without or with knockdown by XGulp1-MO (left and middle panels) and localization of XGulp1-GFP (300 pg, the right panel). Scale bar, 50 µm. (B) Mid-sagittal fractures of Xenopus early gastrulae. The central endodermal blastocoel floor is curved in uninjected, XGulp1-GFP–injected, or XGulp1-MO/XGulp1-GFP–coinjected embryos, but straight in Gulp1ΔC expressing or XGulp1-MO gastrulae (dashed lines; XGulp1-MO, 30 ng; XGulp1-GFP, 900 pg). Red arrowheads, dorsal blastopore; BCR, blastocoel roof; LEM, leading edge mesendoderm that begins to advance on the BCR; V, endoderm of vegetal cell mass. Scale bar, 500 µm. (C) Curvature of blastocoel floor. Embryos from three independent experiments were measured by the Kappa plugin in ImageJ, and results were pooled for each treatment. (D) Explants of mid-sagittal slices of vegetal cell mass fixed immediately after excision (0 hr) and after onset of vegetal rotation (1 hr) uninjected (top) or after Gulp1ΔC mRNA injection (bottom). Yellow dashed lines, endodermal blastocoel floor surface. Average lengths of dashed lines from three independent experiments: 2,381.0 ± 254.5 µm for eight uninjected explants; 1,862.0 ± 285.5 µm for nine Gulp1ΔC mRNA injected explants. Red arrowheads, dorsal blastopore; green arrowheads, border between surface of embryo and blastocoel floor. Scale bar, 200 µm. (E) Cells in vegetal slice explants after injection of ephrinB1-mCherry mRNA alone or together with XGulp1-MO or XGulp1-MO and XGulp1-GFP. Amount of mRNA injected per blastomere is indicated. Explants from three sets of experiments were examined by confocal microscopy. Additional explants analyzed by conventional fluorescence microscopy gave the same results (not shown). White arrowheads point to retracting protrusions, yellow arrowheads to cell regions simultaneously enriched in vesicles and XGulp1-GFP. Scale bars, 50 µm (left) and 30 µm (right). (F and G) Number of intracellular dots per cell. Asterisks indicate significance levels: ****, P < 0.0001; not significant, P = 0.286; two-tailed Student’s t test.

