Figure 3.
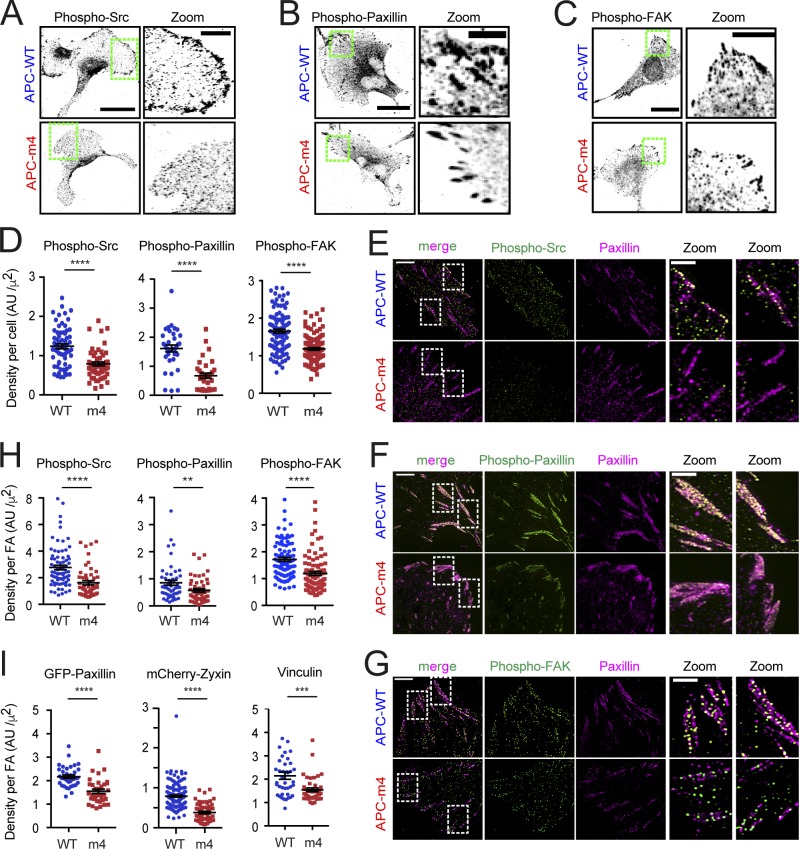
APC-m4 decreases the levels and/or densities of key molecular components at FAs. All data are from MDA-MB-231 cells expressing APC constructs (APC-WT or APC-m4), using fixed or live cell imaging as indicated. (A) Representative immunostaining of endogenous active phospho-Src detected by confocal imaging. Scale bar, 40 µm. Green boxed regions correspond to zoom panels (right; scale bar, 10 µm), which highlight the localization of phospho-Src at the cell periphery. (B) Representative immunostaining of endogenous active phospho-paxillin detected by confocal imaging. Scale bar, 25 µm. Green boxed regions correspond to zoom panels (right; scale bar, 5 µm), which highlight the localization of phospho-paxillin at the cell periphery. (C) Representative immunostaining of endogenous active phospho-FAK tyrosine kinase detected by confocal imaging. Scale bar, 25 µm. Green boxed regions correspond to zoom panels (right; scale bar, 5 µm), which highlight the localization of phospho-FAK at the cell periphery. (D) Densities of endogenous phospho-Src, phospho-paxillin, and phospho-FAK determined from cell images as in A–C. Data averaged from three independent experiments. n ≥ 56 cells for phospho-Src, n = 35 cells for phospho-paxillin, and n ≥ 103 cells for phospho-FAK per condition. Error bars, SEM. Statistical significance calculated by nonparametric Mann–Whitney two-tailed Student’s t test: ****, P < 0.0001. (E) Representative SIM images of cells immunostained for phospho-Src (green) and paxillin (pink). Scale bar, 5 µm. White boxed regions correspond to zoom panels (right; scale bar, 2 µm), highlighting the localization of phospho-Src and paxillin at FAs. (F) Representative SIM images of cells immunostained for phospho-paxillin (green) and paxillin (pink). Scale bar, 5 µm. White boxed regions correspond to zoom panels (right; scale bar, 2 µm), highlighting the localization of phospho-paxillin and paxillin at FAs. (G) Representative SIM images of cells immunostained for phospho-FAK (green) and paxillin (pink). Scale bar, 5 µm. White boxed regions correspond to zoom panels (right; scale bar, 2 µm), highlighting the localization of phospho-paxillin and paxillin at FAs. (H) Density of phospho-Src, phospho-paxillin, and phospho-FAK staining at individual FAs from cell images as in E–G. Data averaged from two independent experiments. n = 50 FAs total from 15 cells per condition. Error bars, SEM. Statistical significance calculated by nonparametric Mann–Whitney two-tailed Student’s t test: ****, P < 0.0001; **, P < 0.01. (I) Densities of signals at FAs for different components: GFP-paxillin and mCherry-zyxin densities were measured from cell images captured by TIRF microscopy; vinculin densities were measured from immunofluorescence images captured by confocal microscopy. Data averaged from three independent experiments. n = 34–159 FAs from n > 10 cells per condition. Error bars, SEM. Statistical significance calculated by nonparametric Mann–Whitney two-tailed Student’s t test: ****, P < 0.0001; ***, P < 0.001.

