Figure 5.
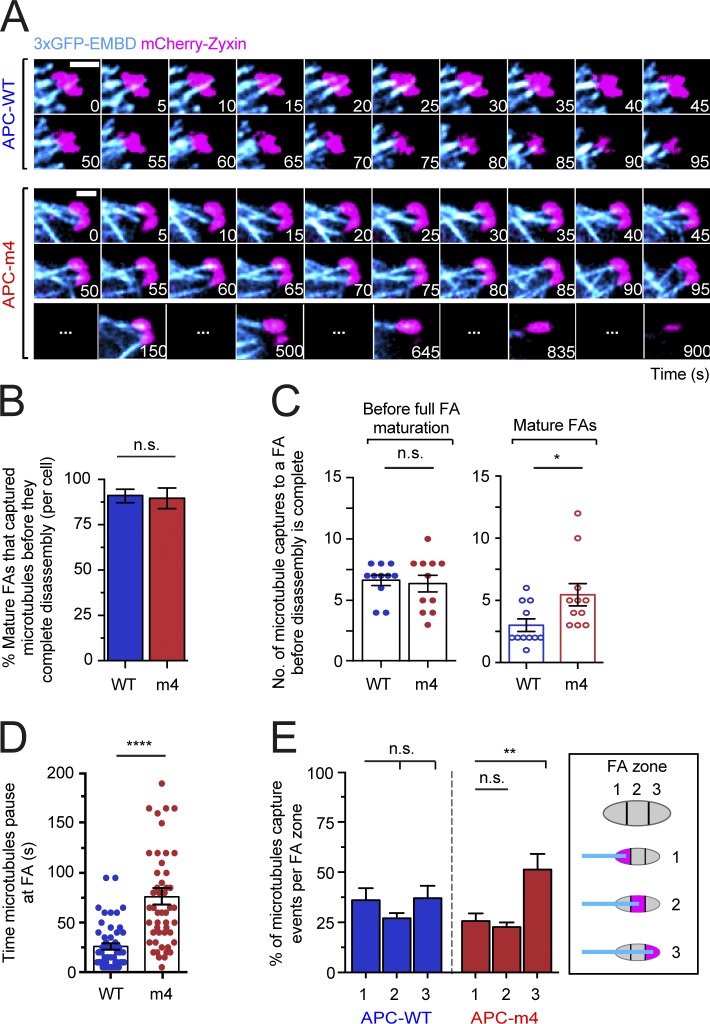
APC-m4 increases the number and duration of microtubule capture events at FAs. All data are from live cell TIRF imaging of migrating MDA-MB-231 cells expressing APC constructs (APC-WT or APC-m4), along with a microtubule marker (3xGFP-EMDB) and FA marker (mCherry-zyxin). (A) Representative time-lapse imaging of microtubules (3xGFP-EMDB; cyan) and FAs (mCherry-zyxin; pink). Scale bar, 4 µm. (B) Percentage of mature FAs (per cell) that capture microtubule plus ends during the 30-min observation window. Data averaged from two experiments as in A; n = 20 cells per condition. Error bars, SD. Statistical significance calculated by nonparametric Mann–Whitney two-tailed Student’s t test: P = 0.9365; n.s., not significant. (C) Scatter plots showing the number of microtubule capture events at individual FAs during FA assembly and disassembly phases (see legends for Fig. 4, C and D, for definitions of phases) from experiments as in A. Data averaged from two experiments; n = 11 FAs per condition from n > 5 cells per condition. Error bars, SEM. Statistical significance calculated by ordinary one-way ANOVA Sidak’s multiple comparisons test: *, P < 0.05; n.s., not significant. (D) Scatter plot showing the durations of microtubule capture events at FAs from experiments as in A. Data averaged from three experiments; n = 50 microtubule capture events per condition from n > 10 cells per condition. Error bars, SEM. Statistical significance calculated by nonparametric Mann–Whitney two-tailed Student’s t test: ****, P < 0.0001. (E) Percentage of microtubule ends that are captured at different regions or “zones” of a FA, from experiments as in A: zone 1, proximal third of FA (relative to microtubule arrival); zone 2, central third; zone 3, distal third. Data averaged from three experiments; n = 90 microtubule capture events per condition from n > 15 cells per condition. Error bars, SEM. Statistical significance calculated by one-way ANOVA Holm–Sidak multiple comparisons test: **, P < 0.01; n.s., not significant.

