Figure 1.
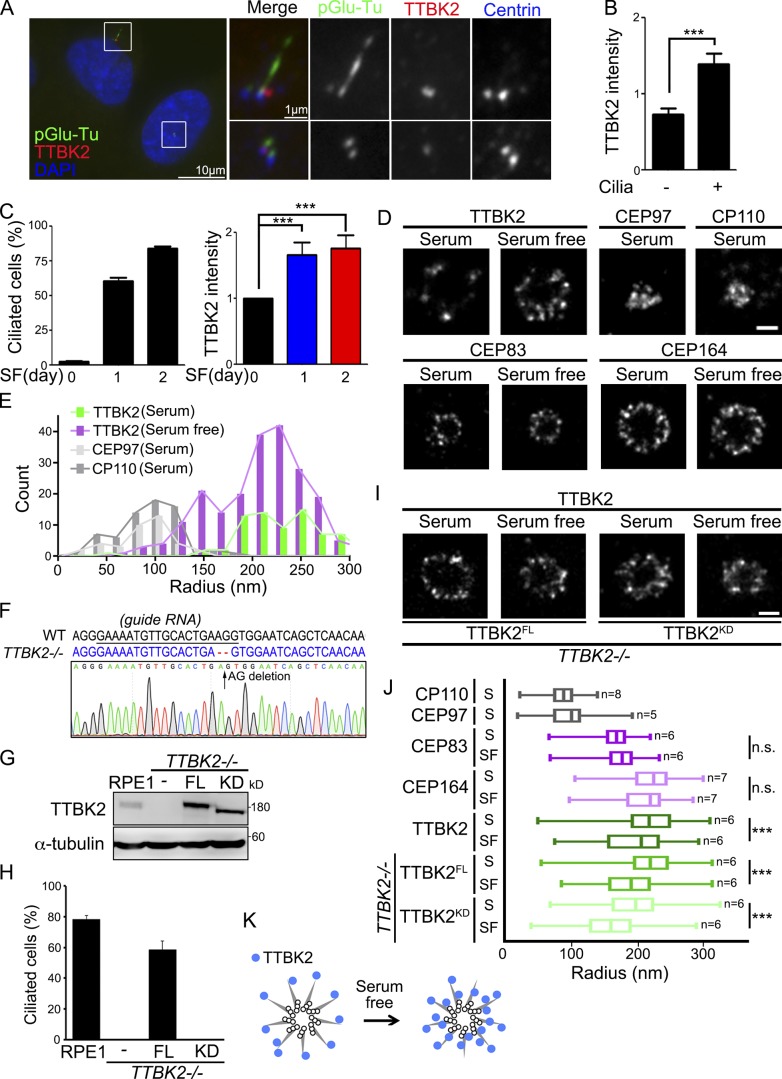
TTBK2 is enriched toward axoneme during ciliogenesis. (A) RPE1 cells were stained with TTBK2 (red), pGlu-Tu (green), and centrin (blue) antibodies. DNA was stained with DAPI (blue). (B) TTBK2 intensity at the centrioles was quantified in ciliated and nonciliated cells. (C) Cells were serum starved (SF) for a different number of days. The percentage of ciliated cells and TTBK2 intensity at the centrioles were quantified. (D) Cells were serum starved for 2 d. The dSTORM images represent the distribution of proteins in radial view at the centrioles in proliferating and serum-starved cells. Scale bar, 200 nm. (E) Histogram analysis of TTBK2, CP110, and CEP97 showing that serum starvation shifted the population of TTBK2 toward the center of centrioles close to CP110 and CEP97. Results are presented for 13, 7, 5, and 8 centrioles for TTBK2 (serum), TTBK2 (serum free), CEP97 (serum), and CP110 (serum), respectively. (F) Sequences analysis of TTBK2 alleles in WT and TTBK2−/− cells. The sequence of WT and edited alleles is in black and blue respectively. The dashed lines represent lesions (AG deletion). (G) FH-TTBK2FL and FH-TTBK2KD were stably expressed in TTBK2−/− cells. Western blot analysis was performed with antibodies against TTBK2 and α-tubulin. (H) Cells were serum starved for 2 d, and the percentage of ciliated cells was quantified. In B, C, and H, >150 cells were analyzed for each independent experiment. Error bars represent mean ± SEM; n = 3. ***, P < 0.001 (Student’s t test). (I) The dSTORM images represent the distribution of TTBK2FL and TTBK2KD in radial view at the centrioles in proliferating cells and serum-starved cells. Scale bar, 200 nm. (J) Quantification of diameters with proteins at the centrioles from D and I. Total cell counts are shown in the figure as n. Error bars represent SD. n.s., not significant. ***, P < 0.001 (Student’s t test). (K) The diagram shows the TTBK2 distribution at centriole DAs during serum starvation.

