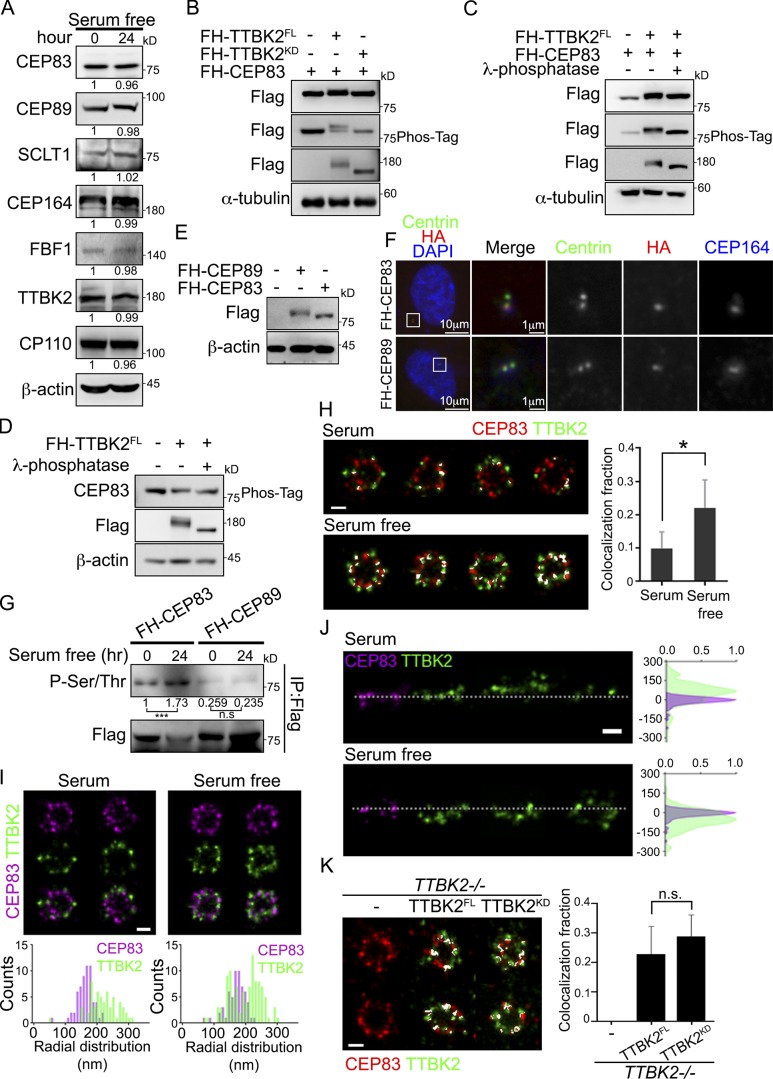
Figure 2.
CEP83 undergoes TTBK2-dependent phosphorylation. (A) Western blot analyses of proteins at the centriole distal end in proliferating and serum-starved cells with the indicated antibodies. Relative amounts of proteins were calculated and normalized to β-actin. (B) 293T cells ectopically expressed FH-TTBK2FL or FH-TTBK2KD together with FH-CEP83. The phosphorylation-induced mobility shift was checked using the reducing and Phos-tag gels followed by Western blot analysis. (C and D) Lysates of 293T cells transfected as indicated were incubated with DMSO (left and middle panel) or alkaline phosphatase (right panel) at 37°C for 1 h. The phosphorylation-induced mobility shift was checked using the reducing and Phos-tag gels followed by Western blot analysis. (E and F) FH-CEP83 or FH-CEP89 is stably expressed in RPE1 cells. Protein expression was confirmed by Western blots (E). Cells were stained with centrin (green), HA (red), and CEP164 (blue) to confirm the localization of CEP83 and CEP89 (F). DNA was stained with DAPI (blue). (G) RPE1 cells stably expressing FH-CEP83 or FH-CEP89 were serum starved for 24 h, and immunoprecipitation (IP) was performed to purify FH-CEP83 or FH-CEP89 using M2 beads. The pulled down complex was immunoblotted with anti-phospho-(Ser/Thr) antibody, and gel bands were quantified. ***, P < 0.001 (Student’s t test). (H) The dSTORM images of TTBK2 and CEP83 in proliferating (serum, n = 6) and serum-starved (serum free, n = 7) cells. Cells were processed for immunofluorescence with anti-TTBK2 and CEP83. The colocalization fraction of TTBK2 and CEP83 is quantified on the right. Error bars represent mean ± SD. *, P < 0.05 (Student’s t test). (I) The radial-view dSTORM images show the distribution of TTBK2 and CEP83 at the centrioles in proliferating and serum-starved cells. (J) The two-color axial-view dSTORM images for TTBK2 and CEP83 illustrate their relative longitudinal positions. (K) Cells were serum starved for 2 d, and the radial-view dSTORM images show the distribution of CEP83 with TTBK2FL or TTBK2KD at centrioles. The results are presented for seven, six, and six centrioles in control, TTBK2FL-, and TTBK2KD-expressing cells, respectively. The colocalization fraction of TTBK2 and CEP83 in each condition is quantified on the right. Error bars represent SD. n.s., not significant. Scale bars, 200 nm (H–K).

