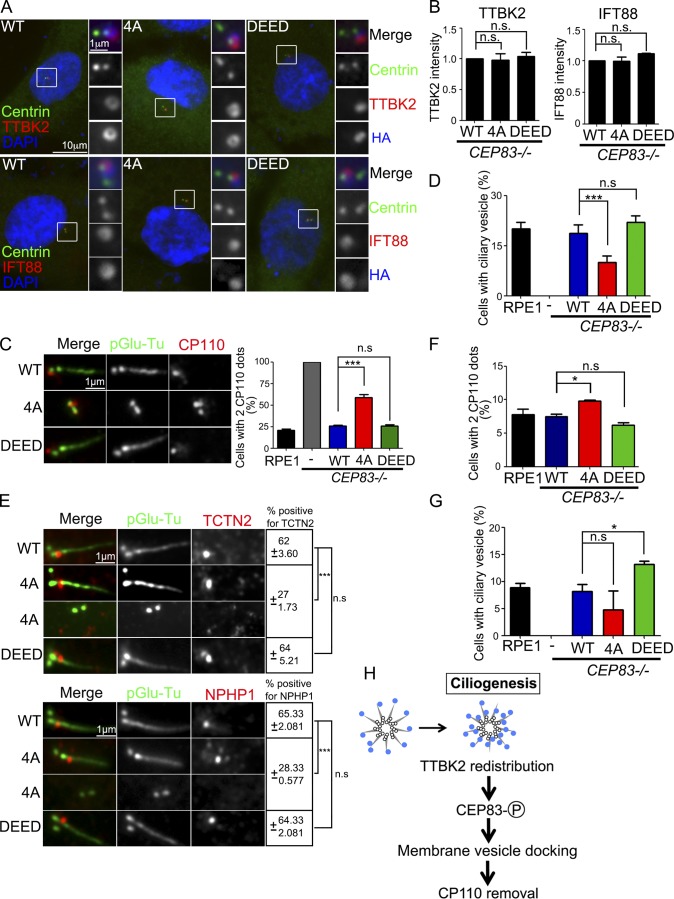
Figure 7.
CEP83 phosphorylation promotes cilia formation at the initial stage. (A) Cells were serum starved for 2 d and analyzed by immunofluorescence with the indicated antibodies. DNA was stained using DAPI (blue). (B) The intensity of TTBK2 and CEP83 signals at the centrioles was quantified. (C) Cells were serum starved for 2 d and processed for immunostaining with antibodies against pGlu-Tu and CP110. Scale bar, 1 µm. Graph showed the percentage of cells with two CP110 dots at the centrioles. (D) Cells were serum starved for 6 h. The percentage of cells contained ciliary vesicles was measured with an antibody against myosin-Va. (E) Cells were serum starved for 2 d and processed for immunostaining with antibodies as indicated. Scale bar, 1 µm. The percentage of cells with positive TCTN2 and NPHP1 signals at the centrioles was quantified. (F and G) In proliferating cells, the percentage of cells with two CP110 dots at the centrioles and the percentage of cells containing ciliary vesicles were quantified. (H) The diagram shows that TTBK2 phosphorylates CEP83 in promoting cilia initiation. In B–G, 200 cells were analyzed for each independent experiment. Error bars represent mean ± SEM; n = 3. n.s., not significant; *, P < 0.05; ***, P < 0.001 by Student’s t test.

