Figure 4.
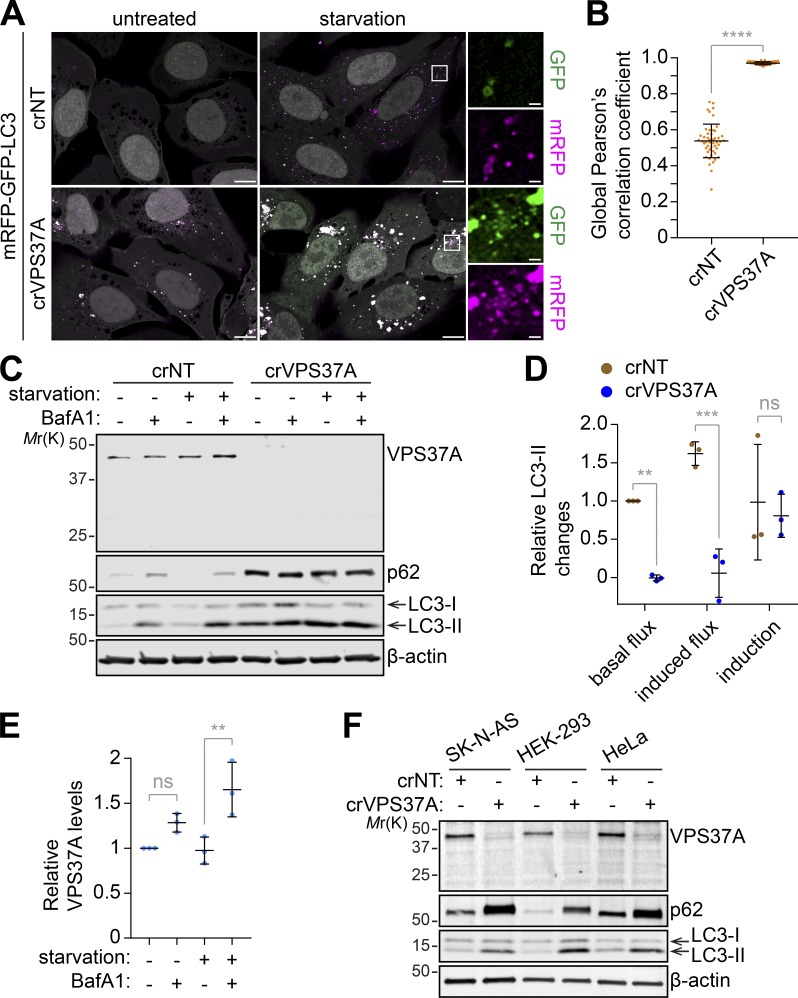
VPS37A depletion impairs autophagic flux. (A) crNT and crVPS37A U-2 OS cells were transduced with lentiviruses encoding mRFP-GFP-LC3, incubated in complete medium or starvation medium for 3 h, and subjected to confocal microscopy. Representative images from three independent experiments are shown. Magnified images in the boxed areas are shown in the right panels. The scale bars represent 10 µm in the main images and 1 µm in the magnified images. (B) The acidification of autophagic structures in starved cells in A was assessed by global Pearson’s correlation coefficient (n = 50). Statistical significance was determined by Mann–Whitney nonparametric t test. (C) The indicated U-2 OS cells were incubated in complete medium or starvation medium in the presence or absence of 100 nM BafA1 for 3 h and subjected to IB using the indicated antibodies. Representative blots from three independent experiments are shown. (D) Autophagic flux under untreated (basal flux) and starvation (induced flux) conditions and autophagy induction in C were calculated as described in Materials and methods and normalized to the value of basal flux (n = 3). (E) Fold changes in VPS37A levels relative to untreated control in C are quantified and shown (n = 3). (F) crNT and crVPS37A SK-N-AS, HEK-293, and HeLa cells were subjected to IB using the indicated antibodies. All values are mean ± SD. **, P ≤ 0.01; ***, P ≤ 0.001; ****, P ≤ 0.0001; ns, not significant.

