Figure 1.
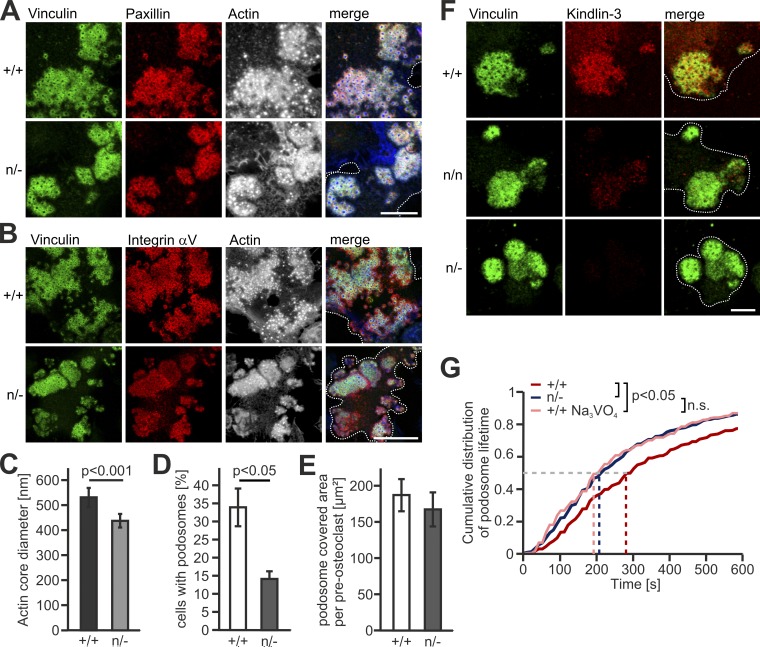
Low kindlin-3 expression results in reduced podosome lifetime. (A) IF stainings of WT (+/+) and K3n/− (n/−) preosteoclasts for vinculin (green), paxillin (red) and actin (white/blue in merge). Scale bar, 10 µm. (B) IF stainings for vinculin (green), integrin αV (red), and actin (white/blue in merge) in podosomes of +/+ and n/− preosteoclasts. Scale bar, 20 µm. (C) Diameter of the podosomal actin cores in +/+ and n/− cells. 10 actin cores in two regions of three cells were measured per experiment. n = 5. (D) Percentage of podosome forming +/+ and n/− preosteoclasts. n = 4. (E) Quantification of the basal cell surface area that podosomal clusters cover in +/+ and n/− preosteoclasts. n = 48/50 from five different preparations. (F) Vinculin (green) and kindlin-3 (red) IF stainings of +/+ and n/− preosteoclasts. Scale bar, 5 µm. (G) Cumulative distribution of podosome lifetimes in +/+ untreated or treated with orthovanadate and n/− preosteoclasts. 15–20 podosomes were measured per cell. Two to five cells were analyzed in each of six different dishes per genotype. See also Videos 1 and 2. Dotted white lines mark cell borders.

