Figure 5.
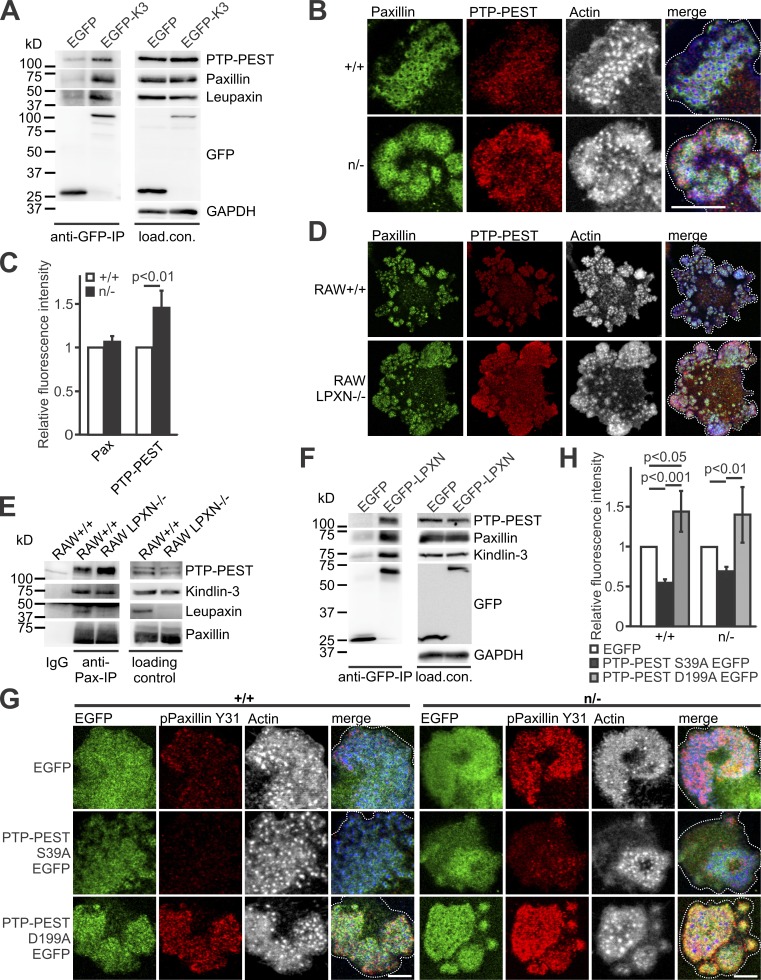
Dephosphorylation of paxillin by PTP-PEST depends on kindlin-3–mediated recruitment of leupaxin into podosomes. (A) GFP-IP from K3−/− RAW cells, retrovirally transduced with GFP alone or a N-terminally GFP-tagged kindlin-3 analyzed for leupaxin, paxillin, and PTP-PEST. (B) IF staining of +/+ and n/− preosteoclasts for paxillin (green), PTP-PEST (red), and actin (white/blue in merge). Scale bar, 10 µm. (C) IF stainings shown in B were quantified by measuring fluorescence intensity. Values from WT cells were set to 1. In each independent experiment, five podosome regions in each of at least 10 cells were measured. n = 5. (D) Control and leupaxin−/− RAW cells stained for paxillin (green), PTP-PEST (red), and actin (white/blue in merge). Scale bar, 20 µm. (E) IP using a mouse–anti-paxillin antibody or an IgG control with lysates from +/+ and leupaxin−/− RAW cells. Binding of PTP-PEST, kindlin-3, and leupaxin was tested. (F) GFP-IP from lysates of leupaxin−/− RAW cells, retrovirally transduced with GFP alone or a N-terminally GFP-tagged leupaxin analyzed for kindlin-3, paxillin, and PTP-PEST. (G) Control and n/− preosteoclasts lentivirally transduced with EGFP, PTP-PEST S39A EGFP, or PTP-PEST D199A EGFP and stained for paxillin phosphorylated at Y31 (red) and actin (white/blue in merge). Scale bars, 5 µm. (H) Quantification of paxillin phosphorylation levels observed in G. n = 5. Dotted white lines mark cell borders.

