Figure 3.
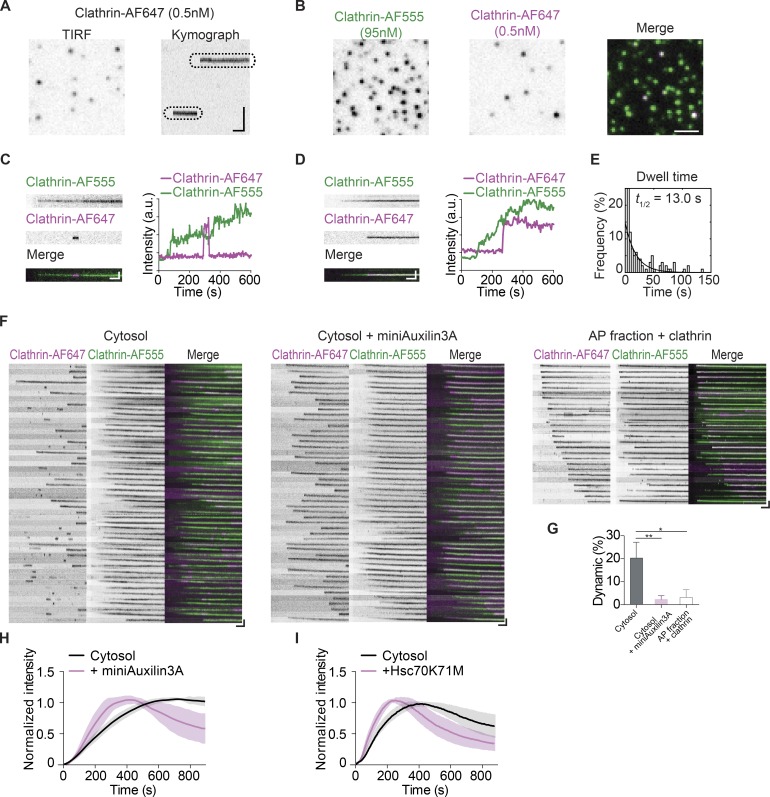
Dynamic and stable clathrin populations on growing CCPs. (A) A single time point TIRF image of a representative single clathrin molecule (Clathrin-AF647). The kymograph was generated from a time-lapse recording. (B) Single frames from time-lapse images of CCP (Clathrin-AF555), its corresponding clathrin single-molecule (Clathrin-AF647) image, and the merged image. The final concentrations of labeled clathrin are indicated. (C and D) Kymographs of a developing CCP with a single Clathrin-AF647 molecule, merged kymographs, and their intensity plots. Two types of single-molecule clathrin events, dynamic (C) and stable (D), are observed. (E) Histogram showing the distribution of the dwell times of dynamic clathrin on CCP and an exponential decay fit (R-square of fit, 0.9783; t1/2 = 13.0 s). (F) Kymographs of individual CCPs during cytosol (left panel), cytosol + miniAuxillin3A (middle panel), or AP fraction + clathrin assembly (right panel). (G) The percentage of single-molecule events during CCP development that are dynamic. Error bars indicate the SEM from three to four experiments; *, P < 0.05; **, P < 0.01, unpaired t test. (H and I) Normalized intensity of CCP real-time assembly induced by cytosol with miniAuxilin3A (H) or Hsc70K71M (I). Each profile in H and I is the average intensity of ROI from >12 membrane sheets. Scale bars, (B) 2 µm; kymograph vertical scale: (A) 2 µm, (C–F) 0.5 µm; kymograph horizontal scale, 1 min.

