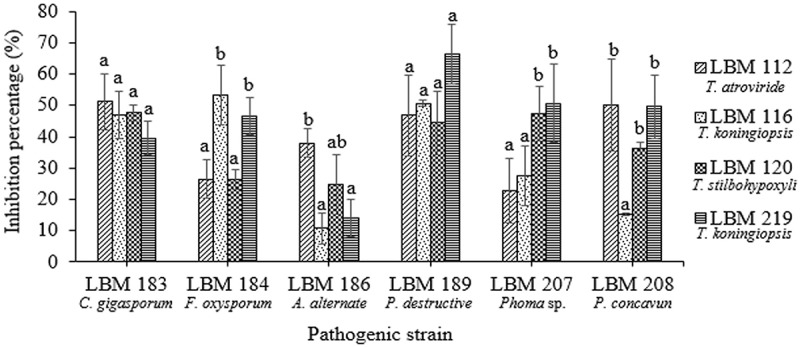
Figure 4.

Percentage of phytopathogen growth inhibition by volatile metabolites produced by Trichoderma strains. Standard error is represented with bars. The letter above the bars indicates homogenous group formation.

Percentage of phytopathogen growth inhibition by volatile metabolites produced by Trichoderma strains. Standard error is represented with bars. The letter above the bars indicates homogenous group formation.