
Figure 2.
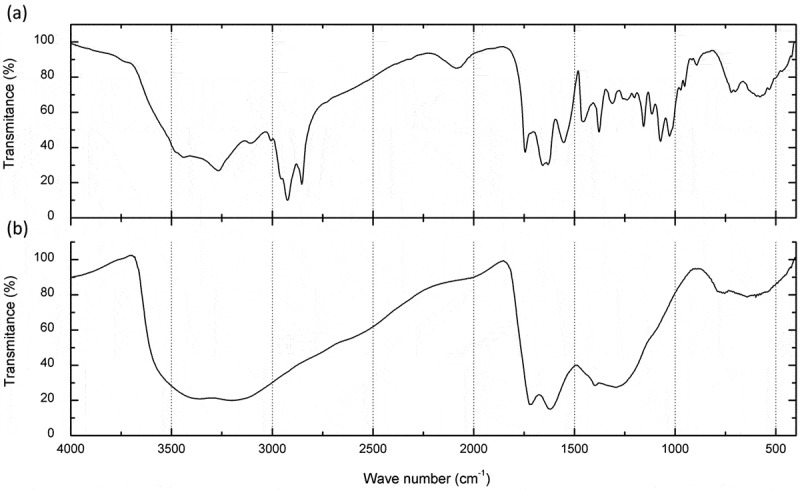
Infrared spectroscopic analysis. a) One milligram of melanin particles extracted from five colonies of D. flagrans and b) 1 mg of commercial melanin. Note that the amplitude of the signals demonstrates the similarity between the commercial and the D. flagrans melanin. The other wave spectra were due to the presence of radicals in the melanin particles extracted from the fungus.